Back

Blog
Small Business Forward Advances a Data-Driven Approach for Entrepreneurial Support
Since 2014, ICIC has been a proud partner of JPMorgan Chase’s Small Business Forward program, a five-year, $75 million initiative working to support small businesses with the potential to generate economic opportunity and strengthen local economies.
As part of this partnership, ICIC has been working closely with a group of entrepreneurial support organizations (ESOs) focused on the high-tech sector to better understand their impact on early-stage businesses. They support businesses in biotechnology and life sciences, cleantech, health IT, water technology and other high-tech sectors. Our annual evaluation of these organizations, now in its third year, captures comprehensive data on their programs and the businesses they support.
Today, high-tech entrepreneurs are transforming economies and creating opportunity in cities across the country. The businesses supported by the ESOs we evaluated are largely staying within their region, spurring job creation and increasing opportunity for residents in their cities.
In 2017, the eight high-tech ESOs we evaluated supported 858 businesses, which raised nearly $171 million in capital, generated nearly $131 million in revenue, and received 148 new patents. The businesses employed 2,890 people and paid $111 million in wages.
As the field of entrepreneurial support continues to mature, our evaluation provides a critical opportunity to better understand what effective support for high-tech, early-stage businesses looks like. Our findings also start to fill a critical data gap for ESOs.
Why Aren’t We Talking More About Benchmarking ESO Performance?
Data and research measuring the performance of ESOs continues to be surprisingly limited. Although more ESOs seem to be capturing data on their programs and the businesses they support, they are doing so largely independently and no standard benchmarking system has emerged.
The growing energy around building entrepreneurial ecosystems is encouraging, and promises to have a powerful impact on communities throughout the U.S. Yet, to date, conversations around ecosystem building have largely been focused on creating cultures of entrepreneurship, building trust in communities, investing in collaboration, and celebrating the impact of entrepreneurs, but not on measuring effectiveness or impact.
The excitement around entrepreneurial ecosystem building, paired with the ongoing proliferation of ESOs across the U.S., presents a critical opportunity to ensure a data-driven approach to supporting entrepreneurs. We need to make sure that “ecosystem builders” are equipped with not only the strategies for building a vibrant ecosystem, but the metrics and data to understand the “what works” of entrepreneurial support.
In order to sustain the emerging field of ecosystem building, it is imperative to catalyze a national conversation around data collection and metrics for benchmarking the effectiveness of ESOs.
Benchmarking Metrics for High-Tech ESOs
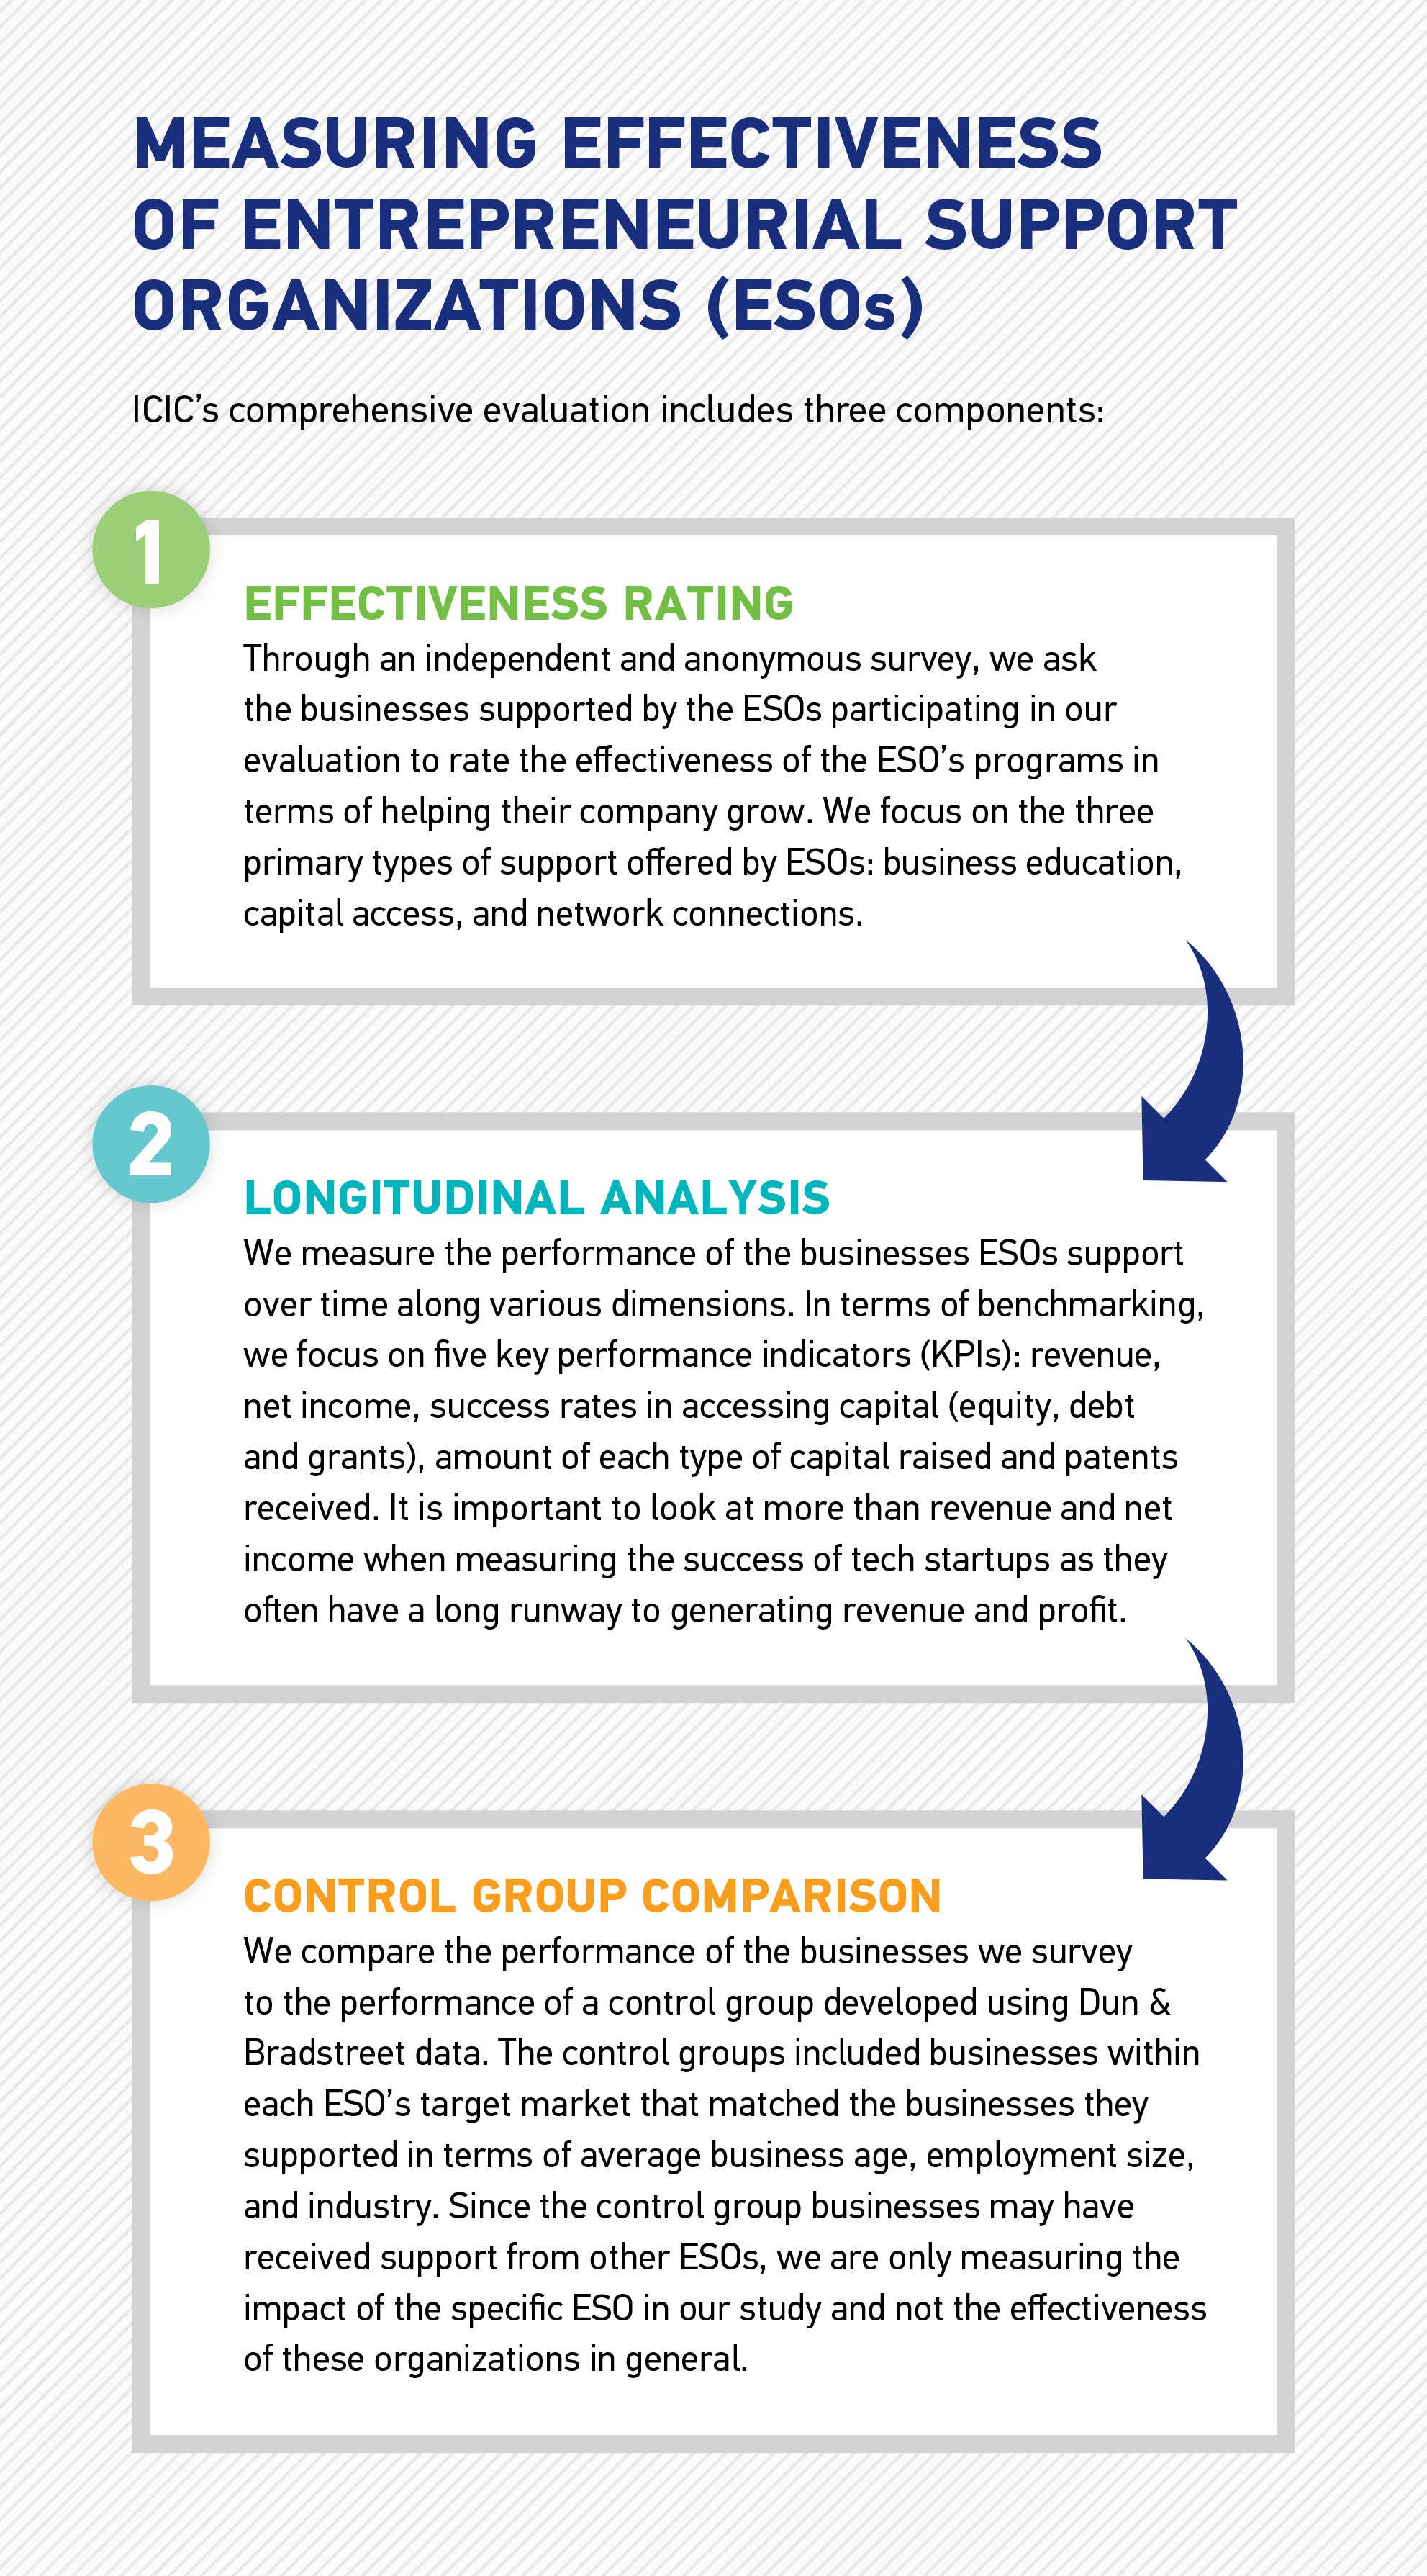
In an effort to jumpstart this discussion and help ESOs understand how they measure up to their peers, we summarize data from three years of our evaluation on program effectiveness and impact (see tables below). The tables highlight findings from an independent, confidential survey of all of the businesses that have received support (currently and in the past) from the ESOs. Since the sample of ESOs and the businesses that responded to the survey has changed slightly from year to year (we have evaluated eight ESOs each year, but two or three have changed each year), we caution the reader against trying to find trends across the three years. Instead, benchmark comparisons should be made within each year.
In 2017, we collected information from 310 businesses supported by eight ESOs. The businesses they support reported an average of 10.2 total employees. Sixty-three percent are five years old or younger, and 67 percent consider themselves to be concept, seed, or early-stage businesses.
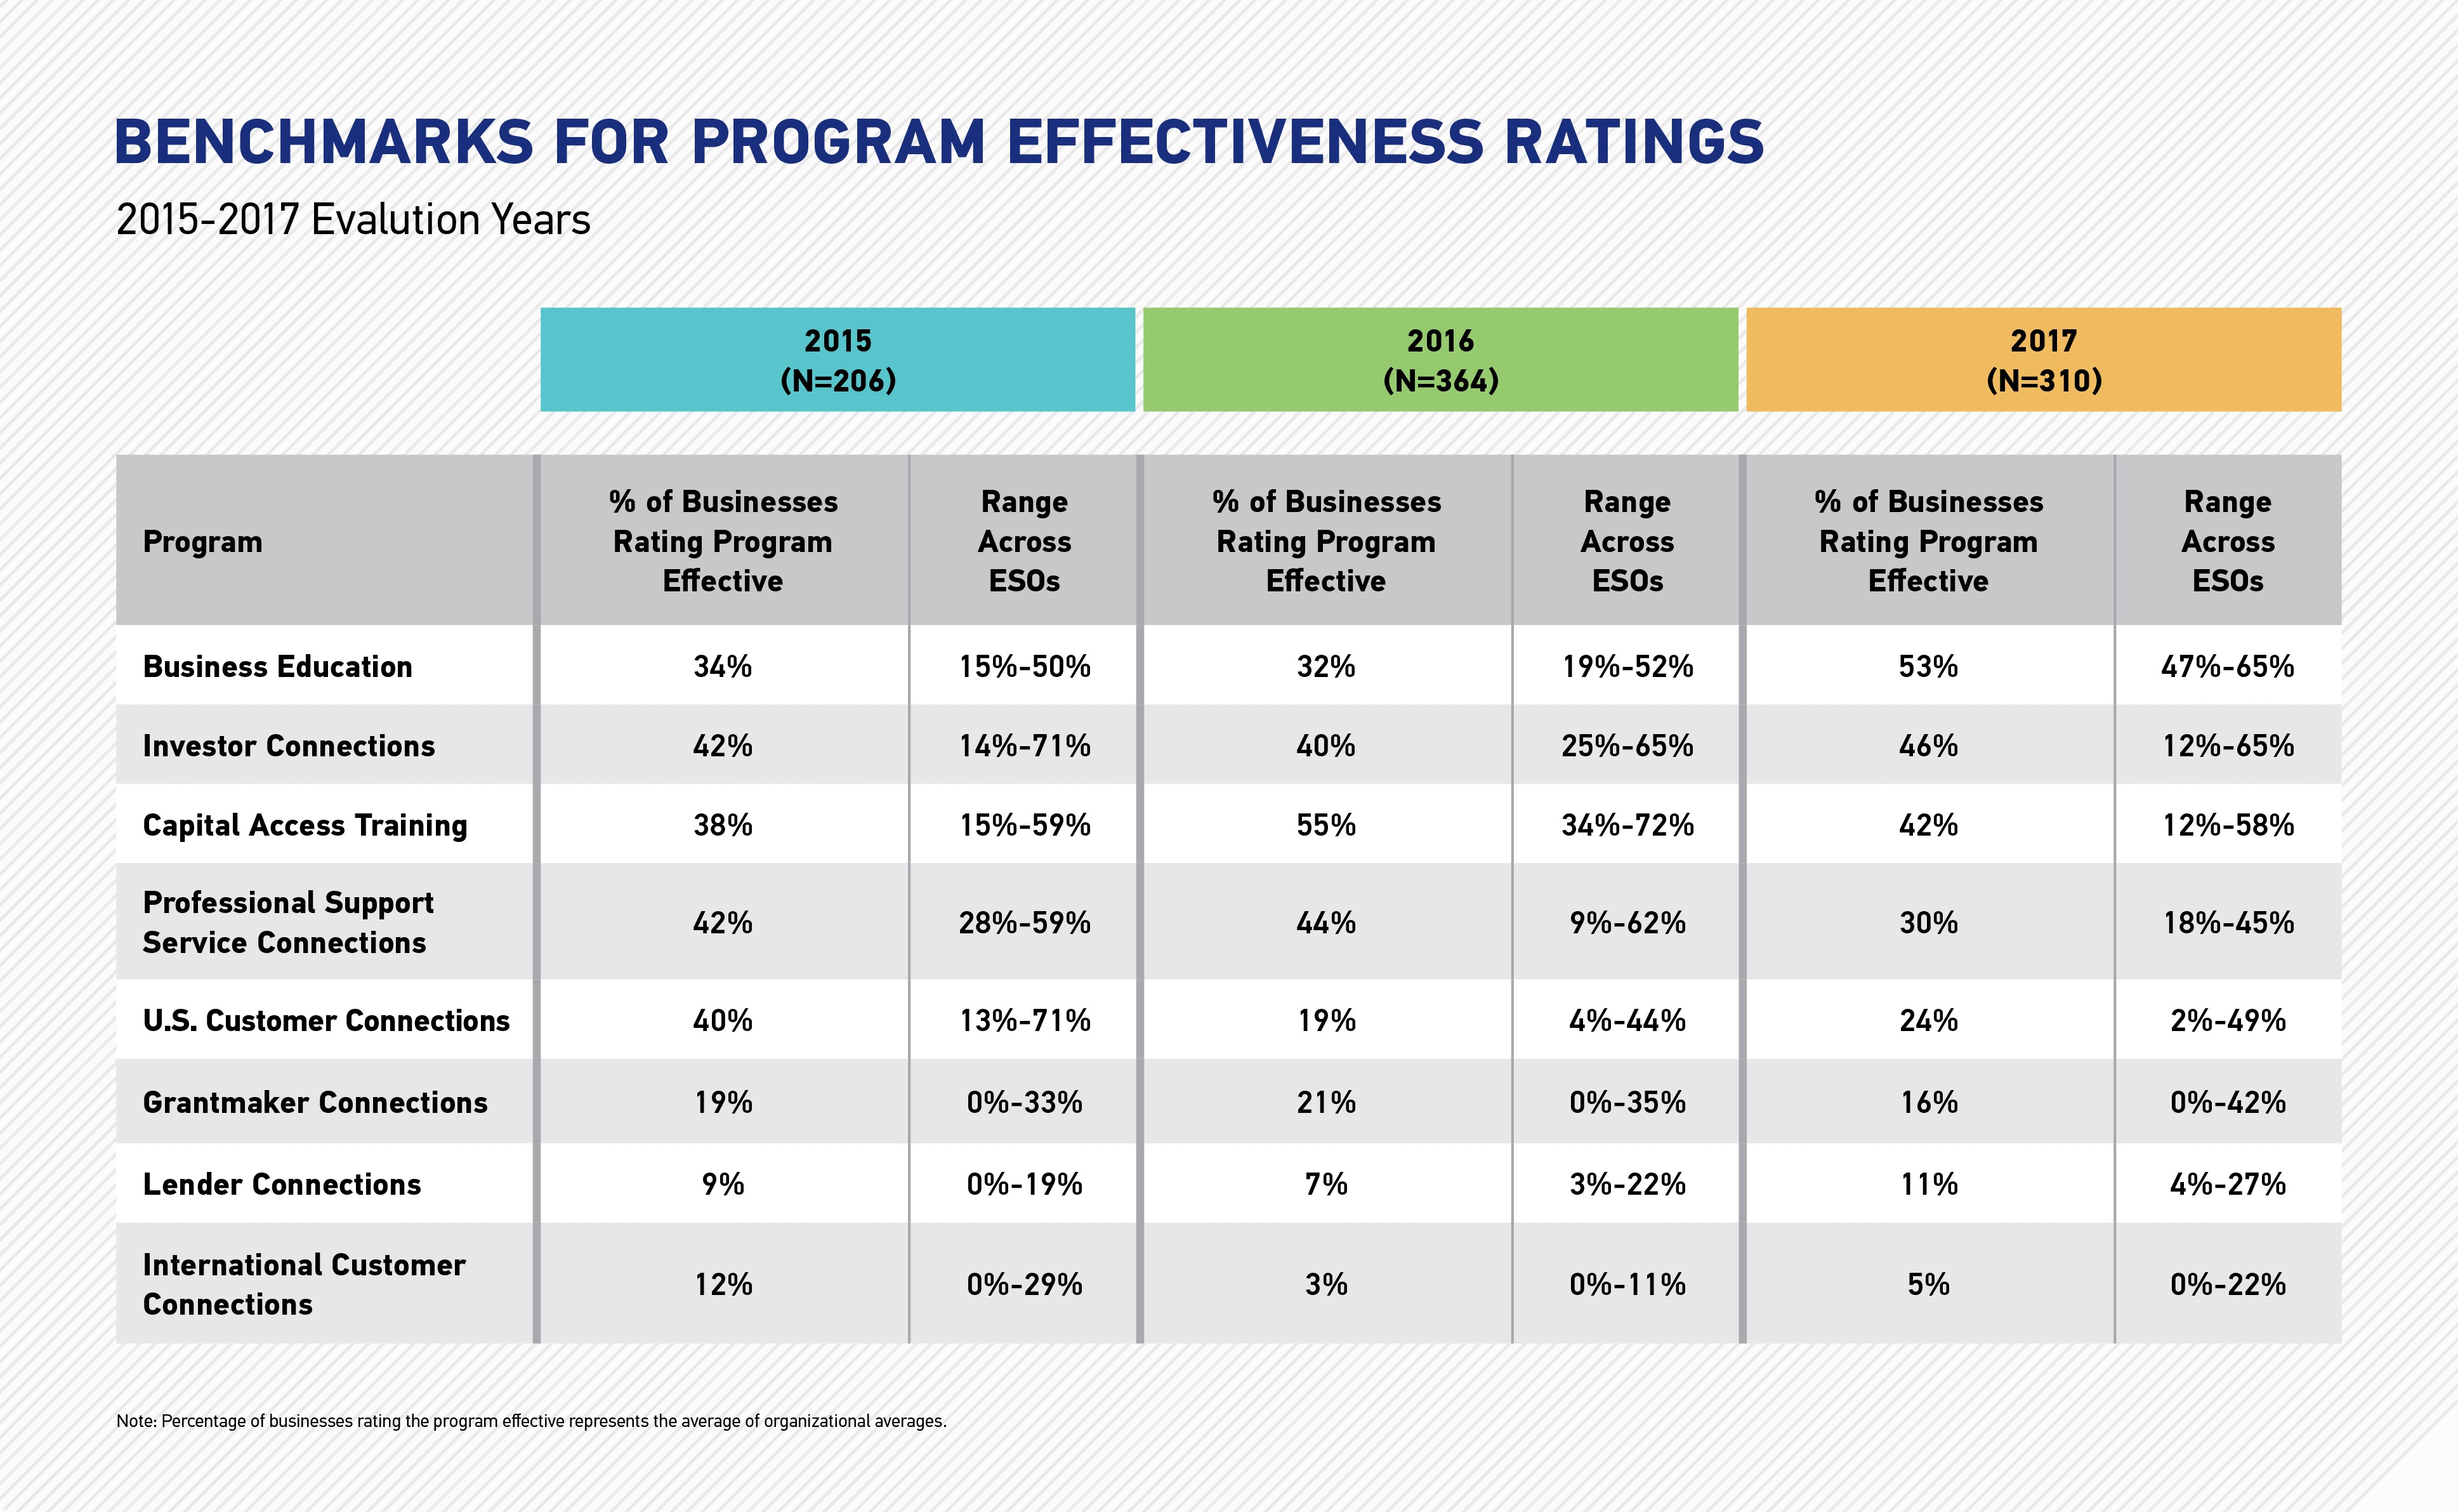
In the first table below, we present benchmarks for ESO program effectiveness, ranked in order from highest to lowest ratings for 2017. On average, the ESOs were rated as most effective at business education followed by facilitating connections to equity investors, and providing capital access training. Connections to capital lenders and international customers are the weakest areas, on average, across all ESOs. Our analysis also clearly shows how performance ratings vary across ESOs. For example in 2017, with connections to equity investors, the average rating for each organization varied from 12 percent to 65 percent.
Looking across years, it is interesting to note how most program effectiveness ratings have remained relatively consistent. Business education and customer connections (domestic and international), however, stand out for their change across time. The businesses we surveyed reported a marked increase in the effectiveness of business education (34 to 53 percent), while they rated down the effectiveness of ESOs on making U.S. customer connections (40 to 24 percent) and international customer connections (12 to 5 percent). While it is difficult to draw conclusions about these trends because of our changing sample, we do know that the ESOs in our sample continue to upgrade the general business education they offer but, like many ESOs, can struggle to effectively connect all of the diverse businesses they support to the right customers. In addition, many do not focus on international customer connections.
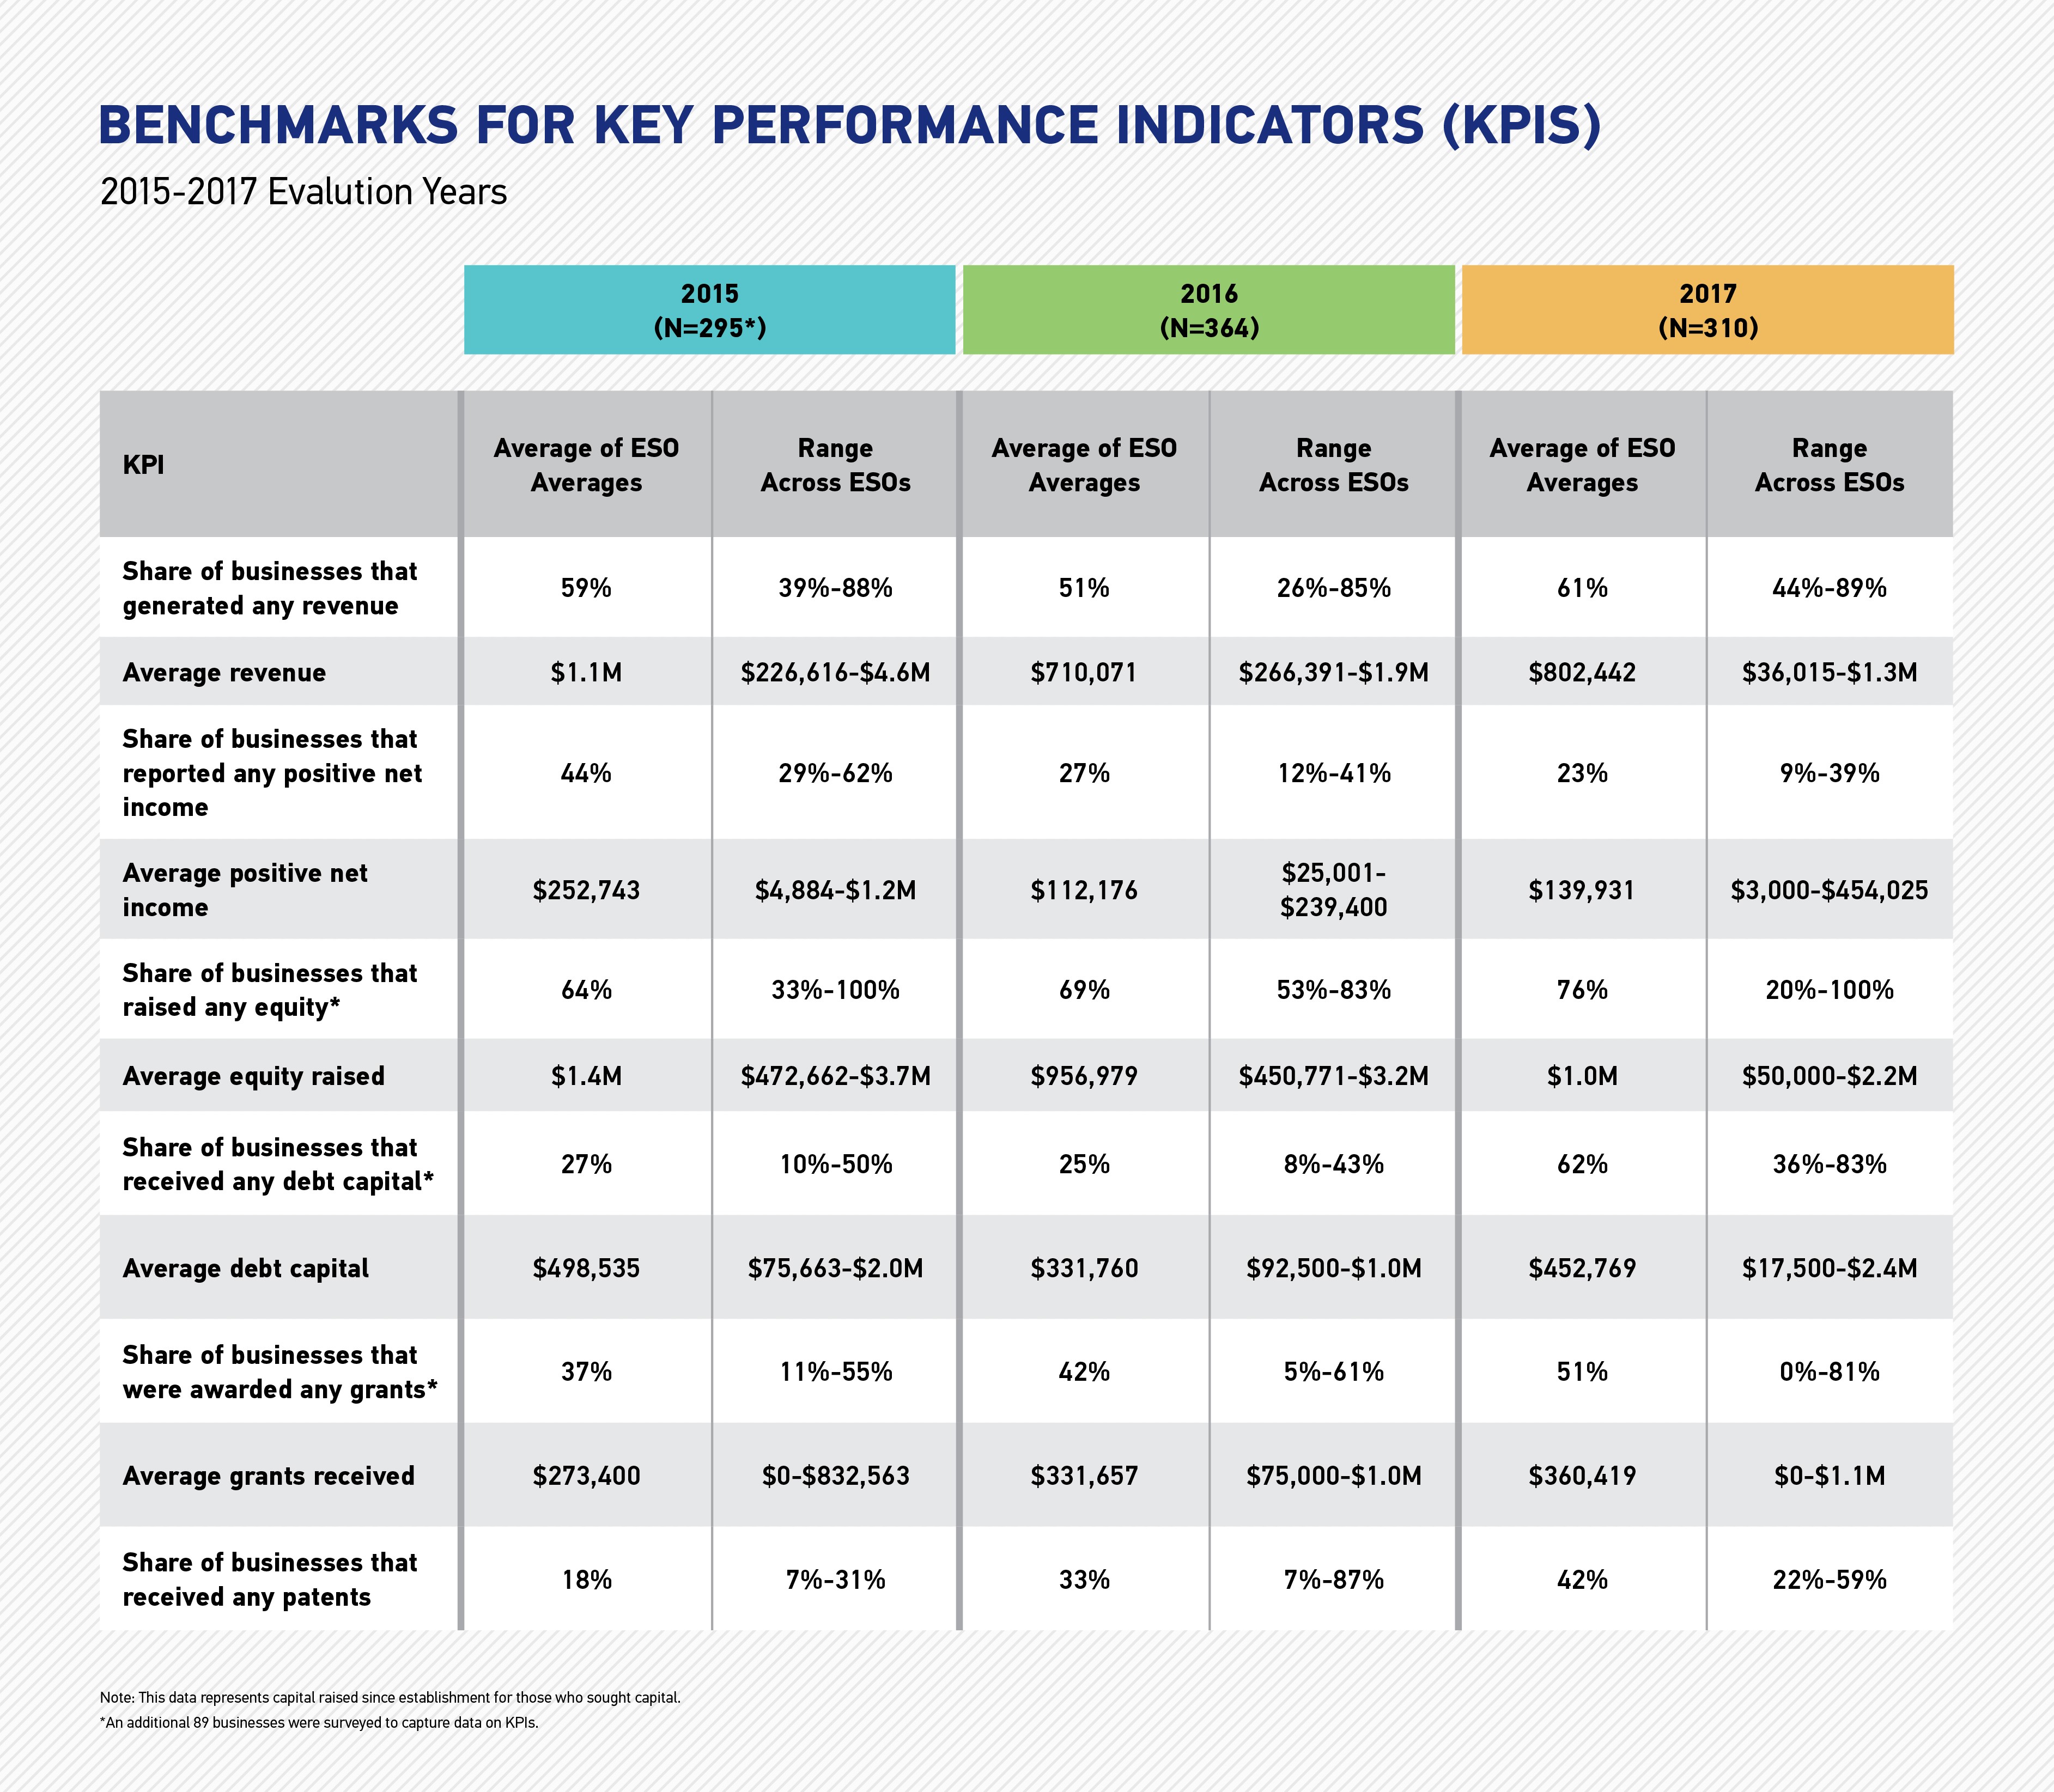
To measure the impact of the ESOs, our survey also captured several performance indicators. In the table below, we report our findings for 11 key performance indicators (KPIs). Given that most of the businesses in our sample are young, it is not surprising that in 2017, on average, over half (61 percent) are earning revenue, but the majority (77 percent) are not yet profitable. In 2017, on average across all organizations, the businesses reported earning just over $800,000 in revenue, but this varied across ESOs—from an average of just over $36,000 to $1.3 million. Of the businesses seeking capital, they were most successful at raising equity (76 percent on average), which is not surprising given that they are being supported by organizations that generally have strong ties to investors.
Fifty-one percent, on average across all organizations, were also successful at securing grants. The range of 0 to 81 percent across ESOs, however, highlights the fact that some of the organizations do not support businesses in finding and securing grants. In 2017, averaging across all organizations, 42 percent of businesses received patents. For one ESO, 59 percent of the businesses reported receiving patents. This demonstrates the potential effectiveness of the organizations in spurring high-tech innovation.
Across the three years, most of the KPIs, like the effectiveness ratings, have remained relatively consistent. However, the share of businesses reporting net income, the share of businesses securing debt and grants, and the share receiving patents stand out for their change across time.
The share of businesses reporting positive net income has declined (44 to 23 percent), which may simply represent different life-cycle stages of the businesses responding to the survey year-over-year. The share of businesses receiving debt capital increased from 27 to 62 percent, and the share awarded grants increased from 37 to 51 percent. While our changing sample prevents us from drawing strong conclusions from these trends, this growth may reflect the fact that the ESOs are becoming more effective at helping their businesses access capital as they grow and mature. The share of businesses receiving patents has also increased, from 18 percent to 42 percent, on average across all organizations.
Control Group Findings
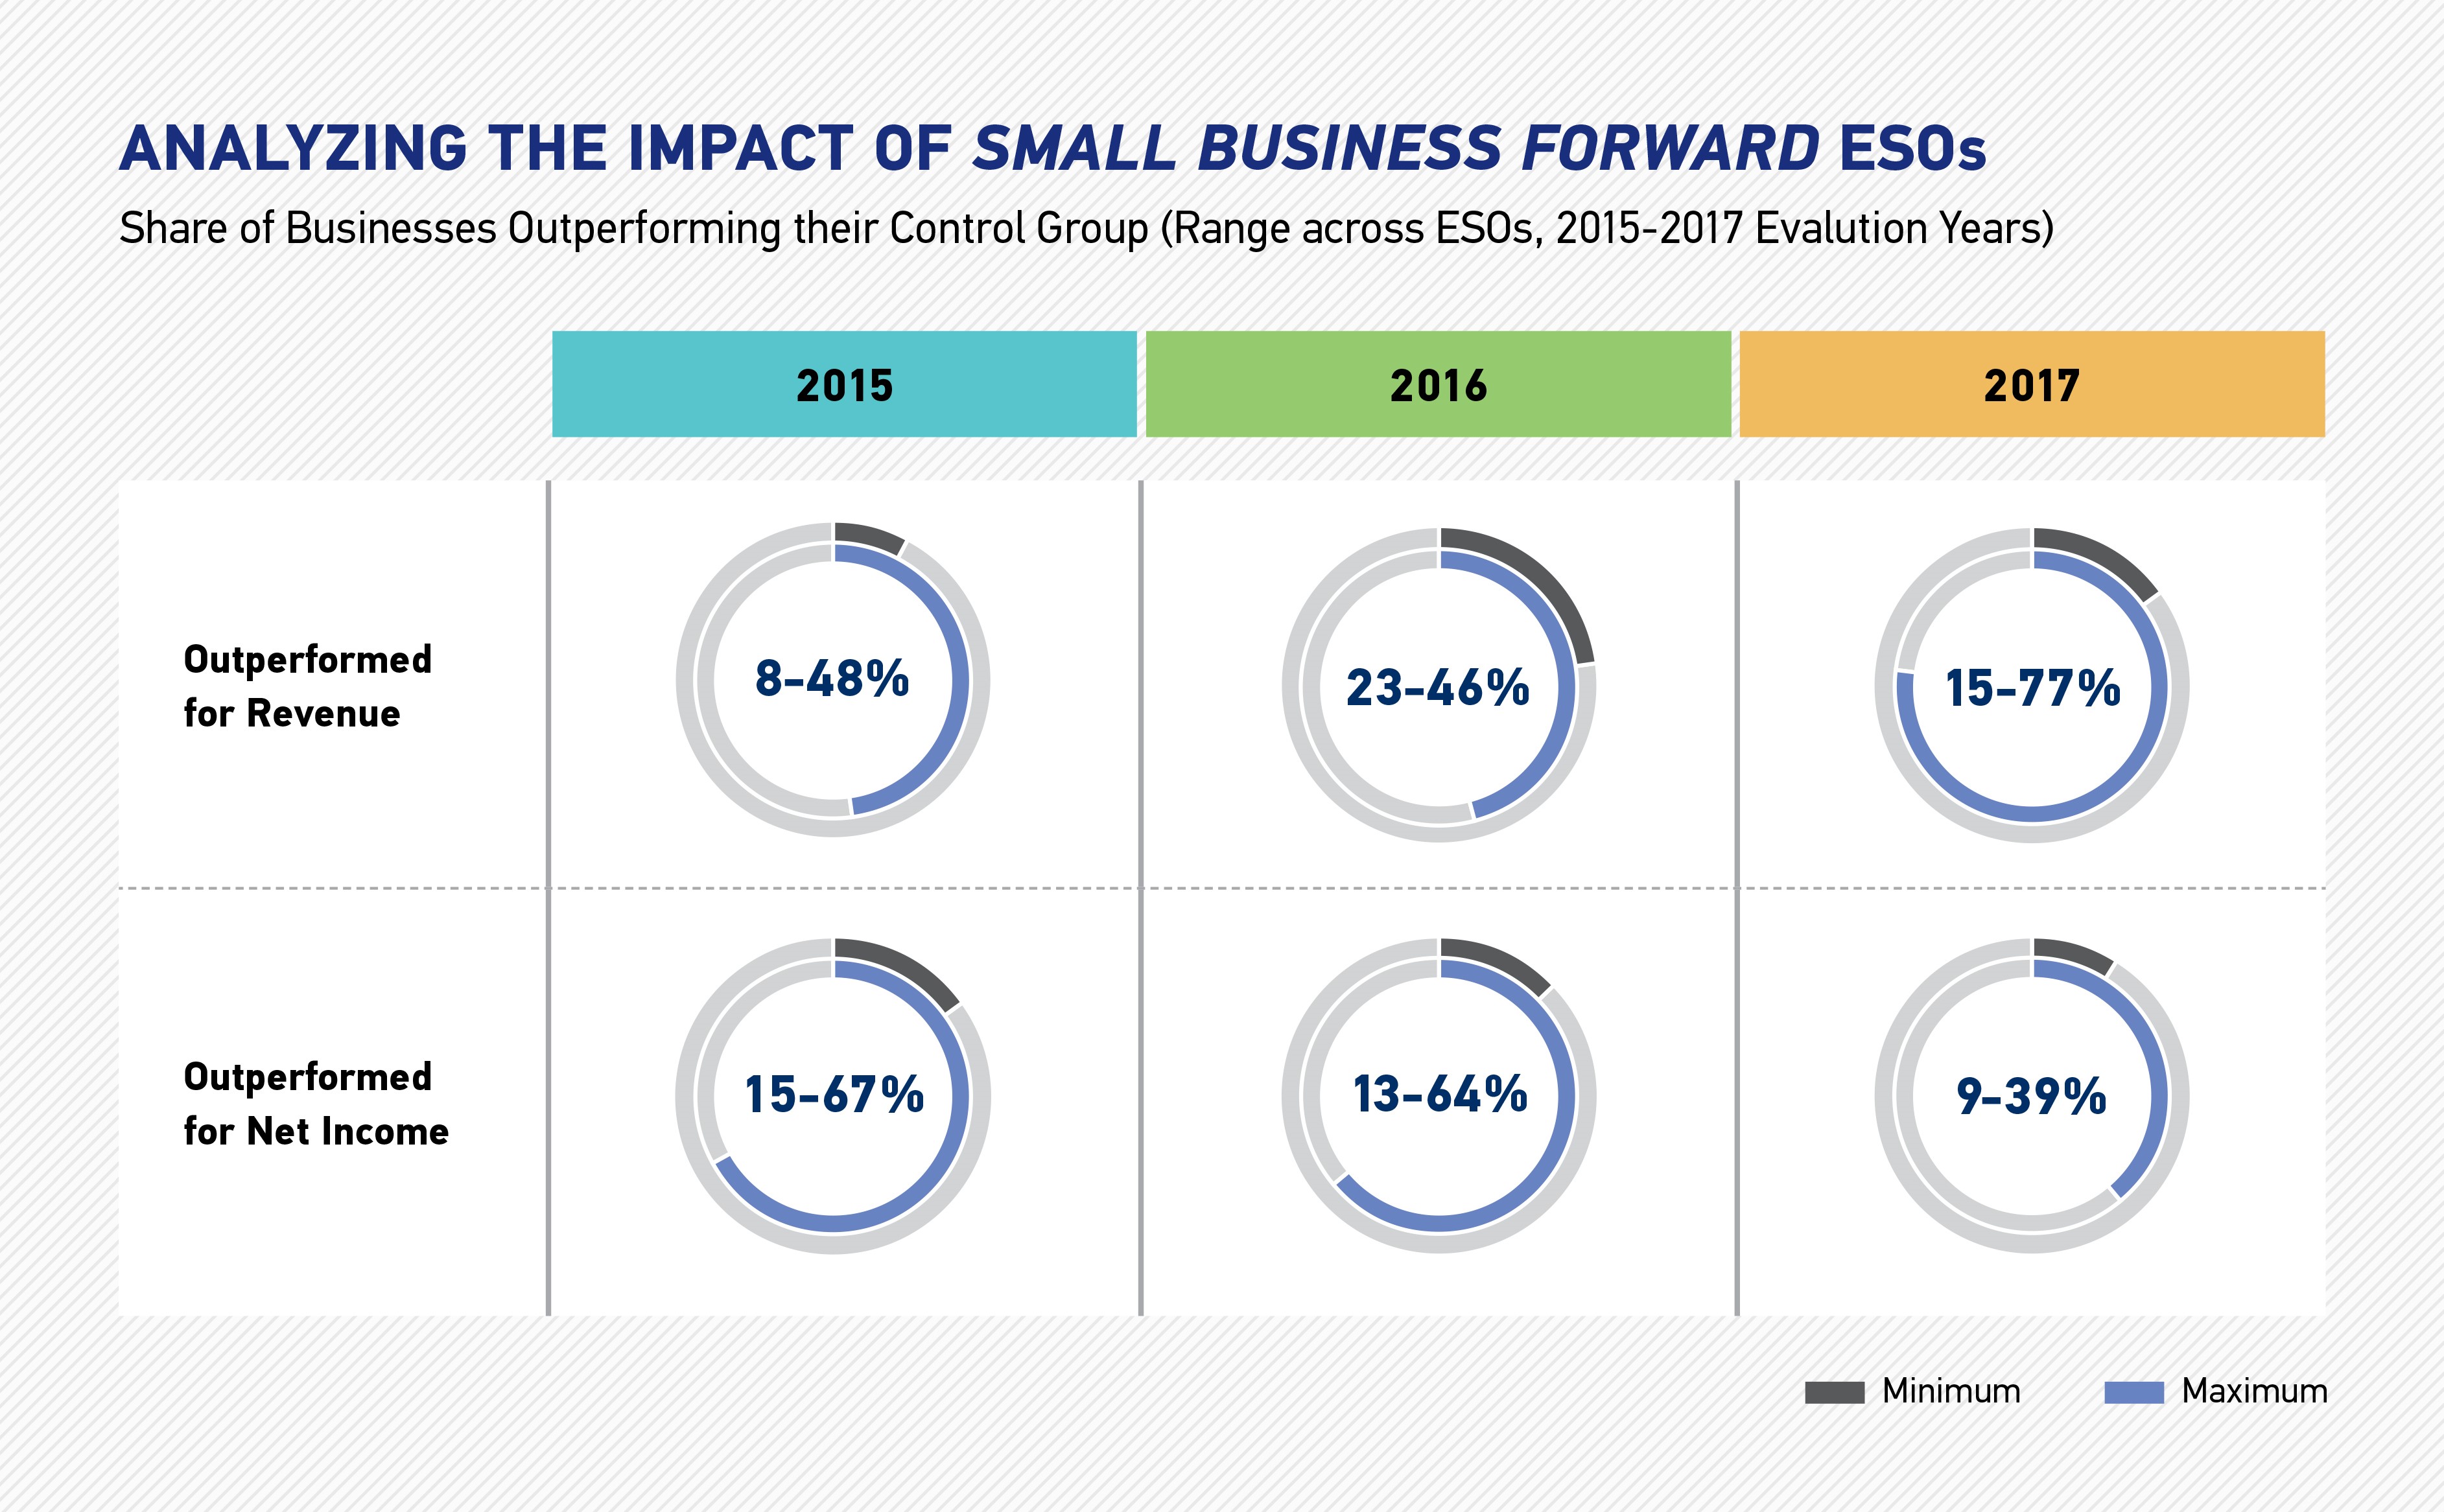
To further measure impact, we conducted a control group analysis comparing the revenue and net income of the businesses supported by each ESO to that of a similar group of businesses not receiving that ESO’s programming or services. In 2017, the share of ESO businesses with a higher revenue than the average revenue of their control group ranged from 15 to 77 percent across the eight ESOs. The share of ESO businesses with a higher net income than the average net income of their control group ranged from 9 to 39 percent.
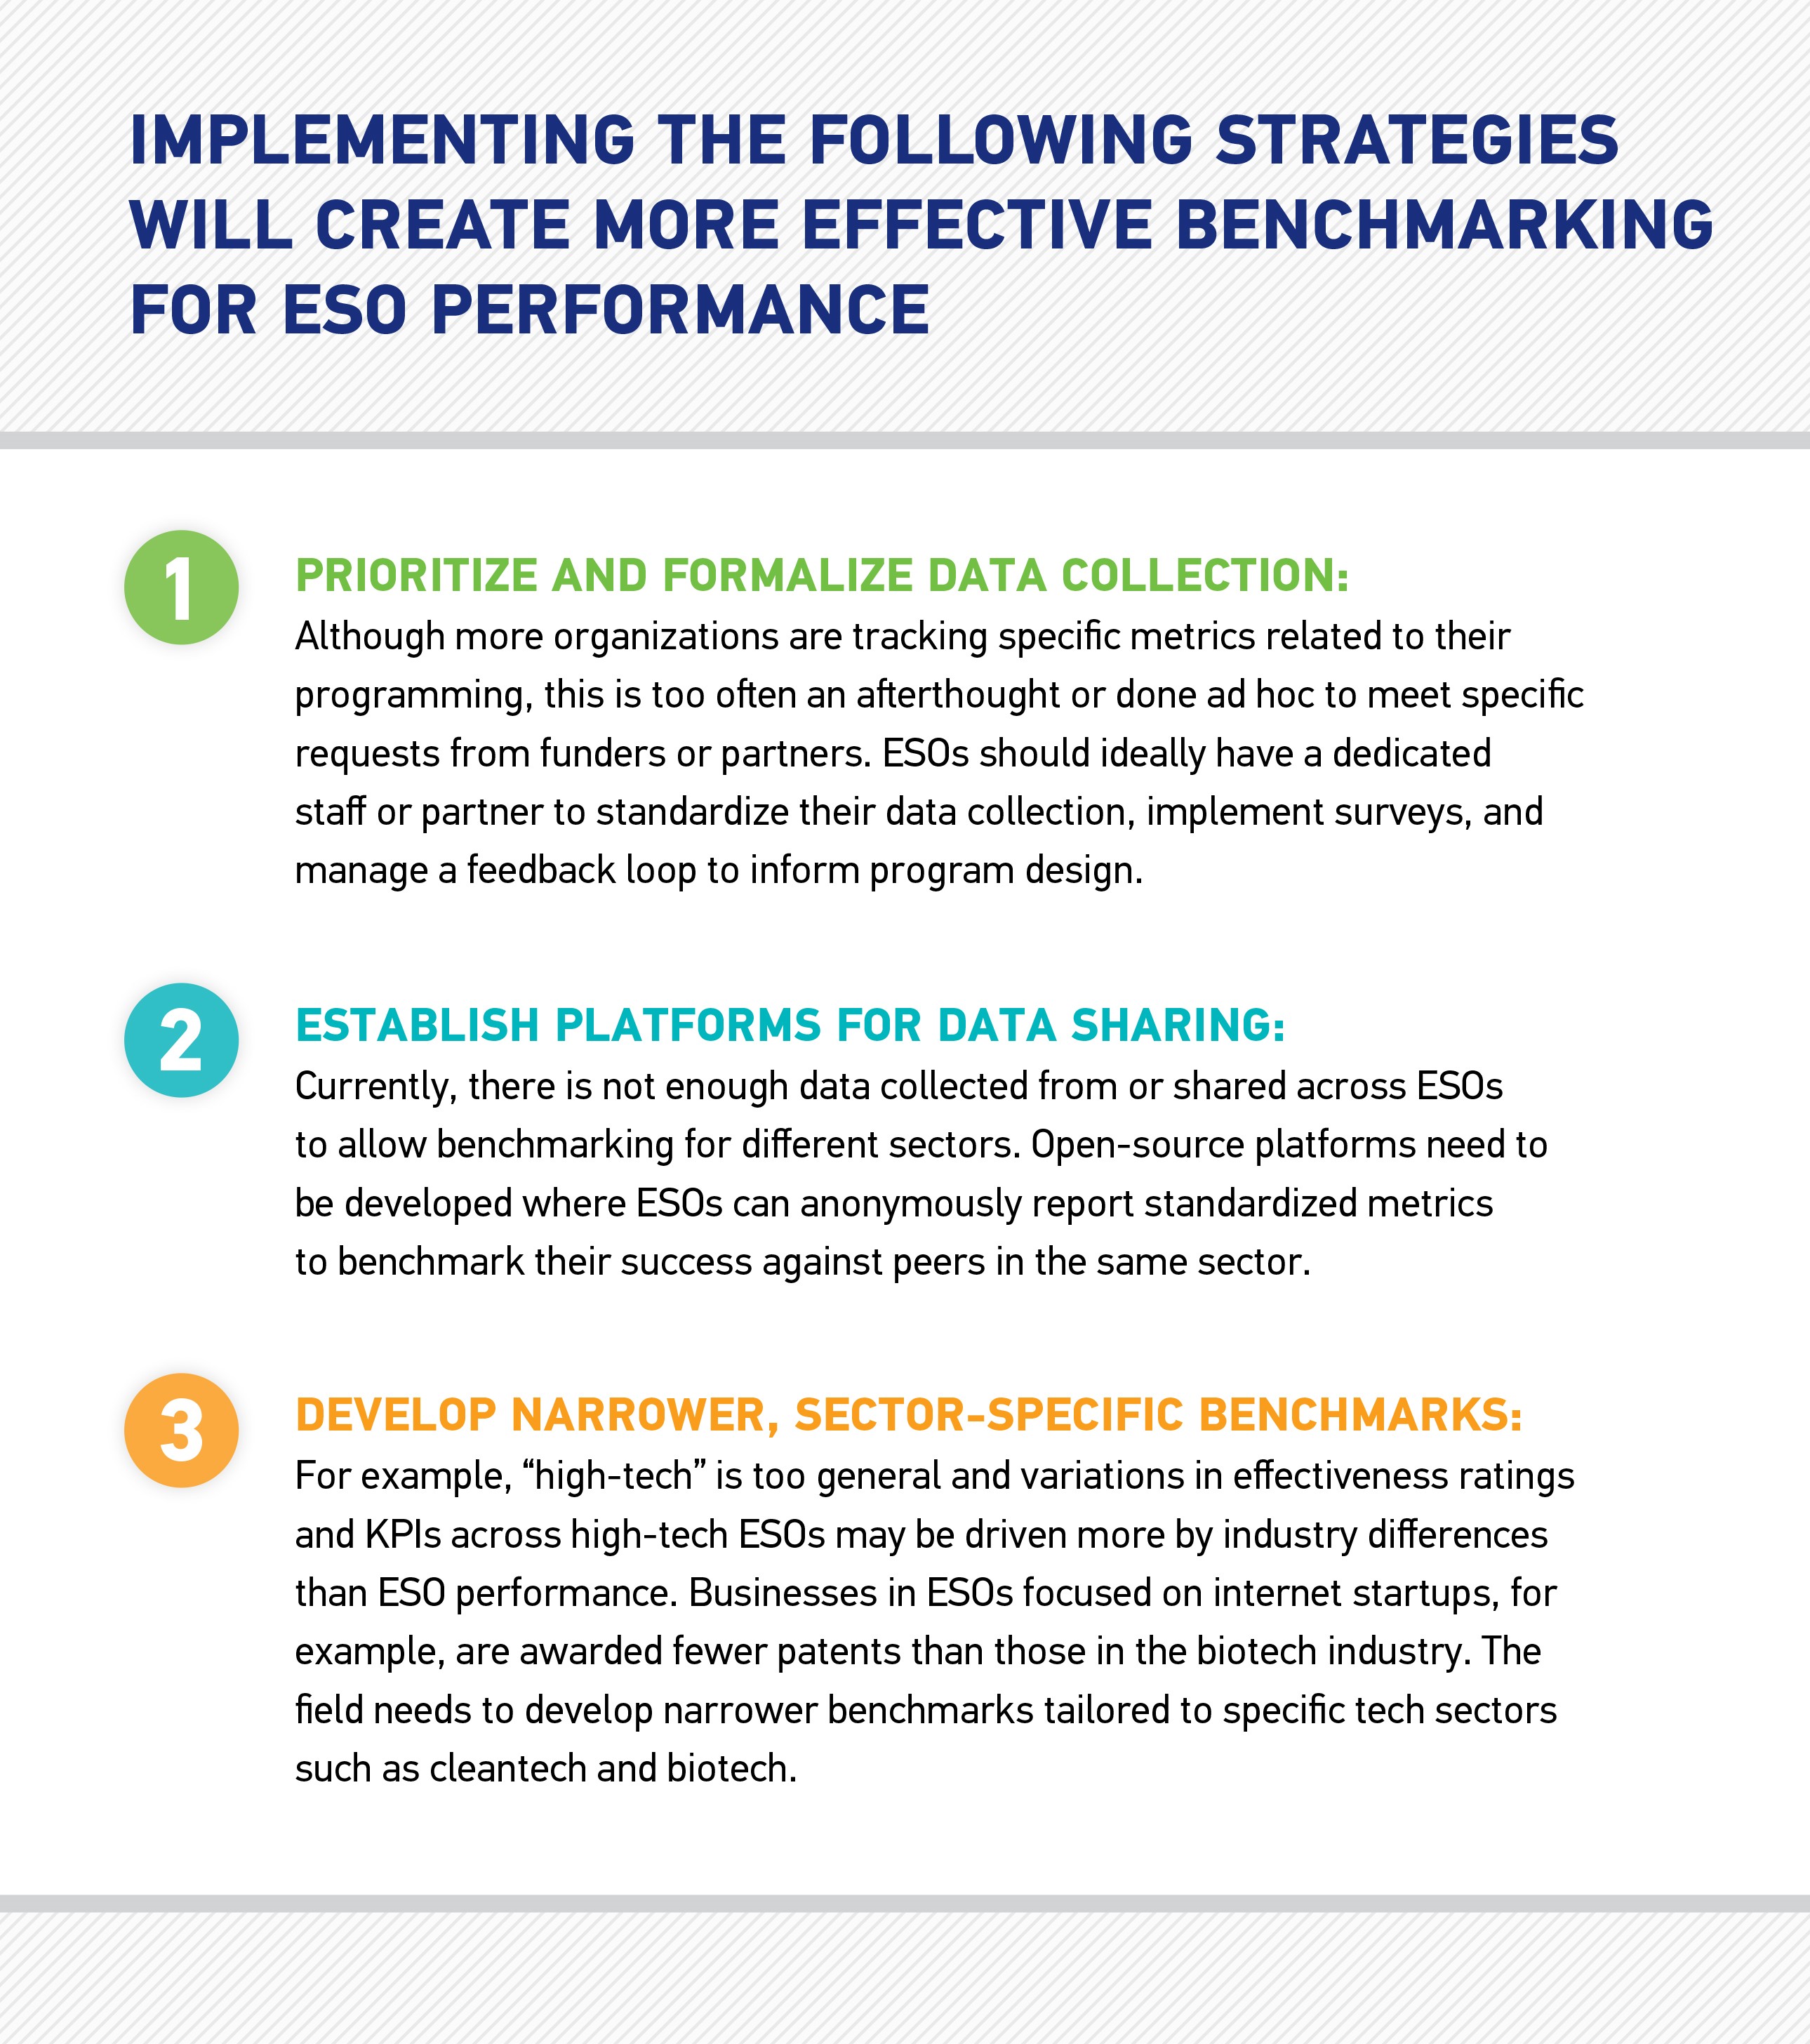
Call to Action: Building Better Benchmarks for High-Tech ESOs
The results of our comprehensive, three-part evaluation suggest that ESOs are important interventions to support the growth of high-tech entrepreneurs. Our evaluation model is also helping leaders in high-tech entrepreneurial support deepen their understanding of effective programming and think about how to benchmark success.
The benchmarks we offer can be a useful starting place for organizations interested inmeasuring their performance against their peers, but are insufficient as ESOs proliferate.
Developing this data-driven approach to entrepreneurial support requires a shift in national conversations. As ESOs proliferate and become increasingly central to urban economic development strategies, it is critical that stakeholders across ecosystems are equipped with a solid understanding of the impact and opportunity of these organizations to drive the growth of the businesses they support.