
Back

Blog
Searching for the Golden Mountain
Demystifying Asian American and Native Hawaiian and Pacific Islander Poverty in Under-Resourced Communities and Its Implications for Economic Development
by Devon Yee, Senior Research Associate, ICIC
February 2023
 When my father immigrated to the United States, his first memory was of an elderly Asian man rooting through the trash in San Francisco’s Chinatown, trying to find something to eat. My father was heartbroken. How could this be? America was supposed to be the land of opportunity, the beautiful country, land of the golden mountain. Yet my father’s first impression of the United States was of glaring inequity. This reality conflicted with the stories my father heard from his parents, themselves immigrants from China to Trinidad and Tobago. No stranger to poverty, what surprised my father was seeing it here in the United States.
Poverty is High in Many AAPI Communities
Asian poverty is often overlooked. The model minority myth describes Asian Americans as uniformly affluent and educated, and the overall poverty rate among Asian Americans is 9.6%, below the national poverty rate of 12.3%. Yet many Asian American and Pacific Islander (AAPI) groups have high poverty levels. Burmese, Micronesian, Native Hawaiian, Bangladeshi, Polynesian, Guamanian, Laotian, Hmong, and Nepalese all have poverty rates at least one percentage point higher than the national poverty rate, ranging from 13.8% among Nepalese to 24.3% among Burmese. At the other extreme, Japanese (7.3% poverty rate), Indians (5.9%), and Filipinos (5.8%) all have poverty rates at or below the non-Hispanic poverty rate of 7.3%. (See figure 1.) Treating Asian Americans and Pacific Islanders as one uniform group fails to recognize this diversity in poverty rates among ethnic groups and ignores the many AAPI groups in which poverty is a major problem.
Figure 1. AAPI groups fall above and below the national poverty rate.
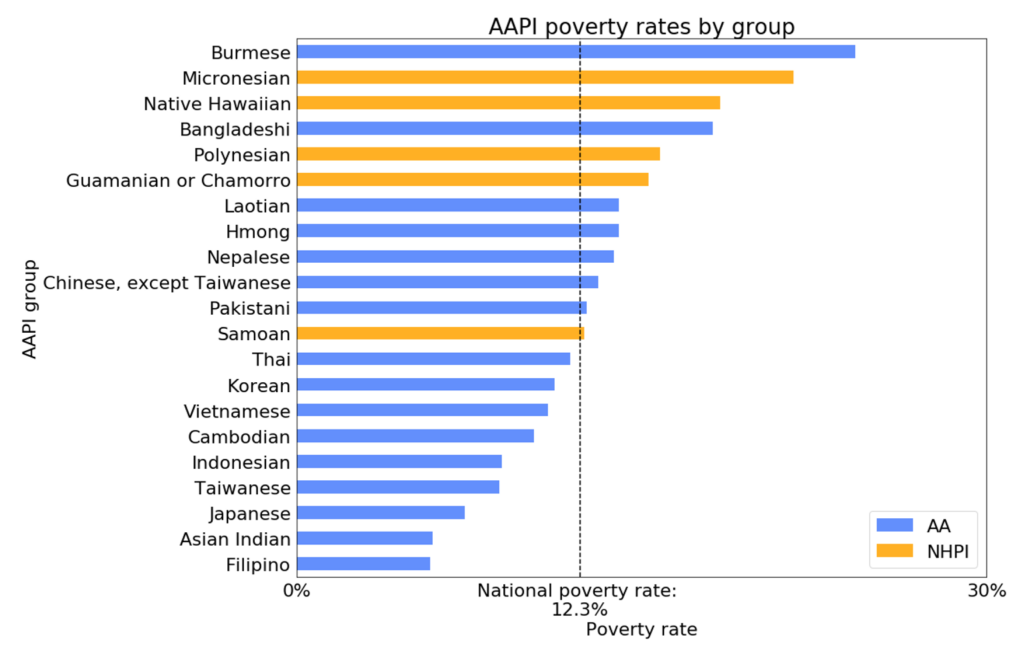 Source: American Community Survey 2019one-year Special Population Profiles. Data for some AAPI groups are not available. Excludes multiracial Asians and Native Hawaiians, and Pacific Islanders.
There are many reasons why poverty rates differ among different AAPI ethnic groups. The occupational and educational status of an immigrant group in its country of origin and the opportunities available to the first generation in the United States can affect the group’s economic well-being. The financial status of immigrants may not reflect the overall well-being of citizens of their countries of origin, especially if immigrants are driven by “pull” factors (seeking educational or economic opportunities) as opposed to “push” factors (fleeing war, genocide, or political persecution). For example, Asian Indian immigrants are highly educated. They have high percentages of their population working in professional occupations, with 79% of Asian Indian immigrants 25 years of age and older holding a bachelor’s degree, compared to 33% of U.S.-born adults. More than 75% of Indian immigrants work in management, business, science, and arts occupations, compared to 41% of all U.S.-born adults. It’s not surprising to see that poverty is rare among members of the Asian Indian diaspora in the United States.
Conversely, Burmese immigrants have lower levels of education, with 56% having less than a high school education, and high percentages of the Burmese population work in production, transportation, and material moving occupations. Burmese communities have poverty rates higher than the national average along with a higher percentage of refugees within its community. Although being a refugee does not necessitate poverty, the specific circumstances of a refugee community as well as the immigration, educational, and occupational status of refugees can affect the group’s poverty rate.
AAPI Groups are Important in Some Under-Resourced Communities
Under-resourced communities (URCs)—heavily populated urban and suburban areas of high poverty and low income—are home to nearly a third of the nation’s poverty population. The percentage of an AAPI group’s residents who live in URCs typically varies with its poverty rate. AAPI groups with relatively low poverty rates (Indians, Japanese, Taiwanese, Filipinos, Indonesians, Vietnamese, Koreans, and Thais) have low percentages of their members living in URCs, with Indians, Japanese, and Taiwanese less likely than non-Hispanic whites to live in URCs.
Many of the AAPI ethnic groups with the highest poverty rates are also among the most likely to live in URCs. For example, the percentages of Burmese, Bangladeshis, Laotians, and Nepalese living in URCs are at least one percentage point greater than the 18.0% of all metropolitan residents living in URCs. Nearly half (46.3%) of Burmese and 40.8% of Hmong live in URCs (figure 2). The percentages of Burmese and Hmong living in under-resourced communities are nearly twice their respective poverty rates. That suggests that many Burmese and Hmong people live slightly above the poverty line. They may have chosen to live in communities of concentrated poverty to be near other members of their ethnic groups or U.S. refugee resettlement policy may have placed them in those communities. This could also be due to affordable housing being concentrated in low-income areas.
Figure 2. We see diversity in the URC rate of residence among AAPI groups, with high-poverty AAPI groups more likely to have higher percentages of their population living within under-resourced communities.
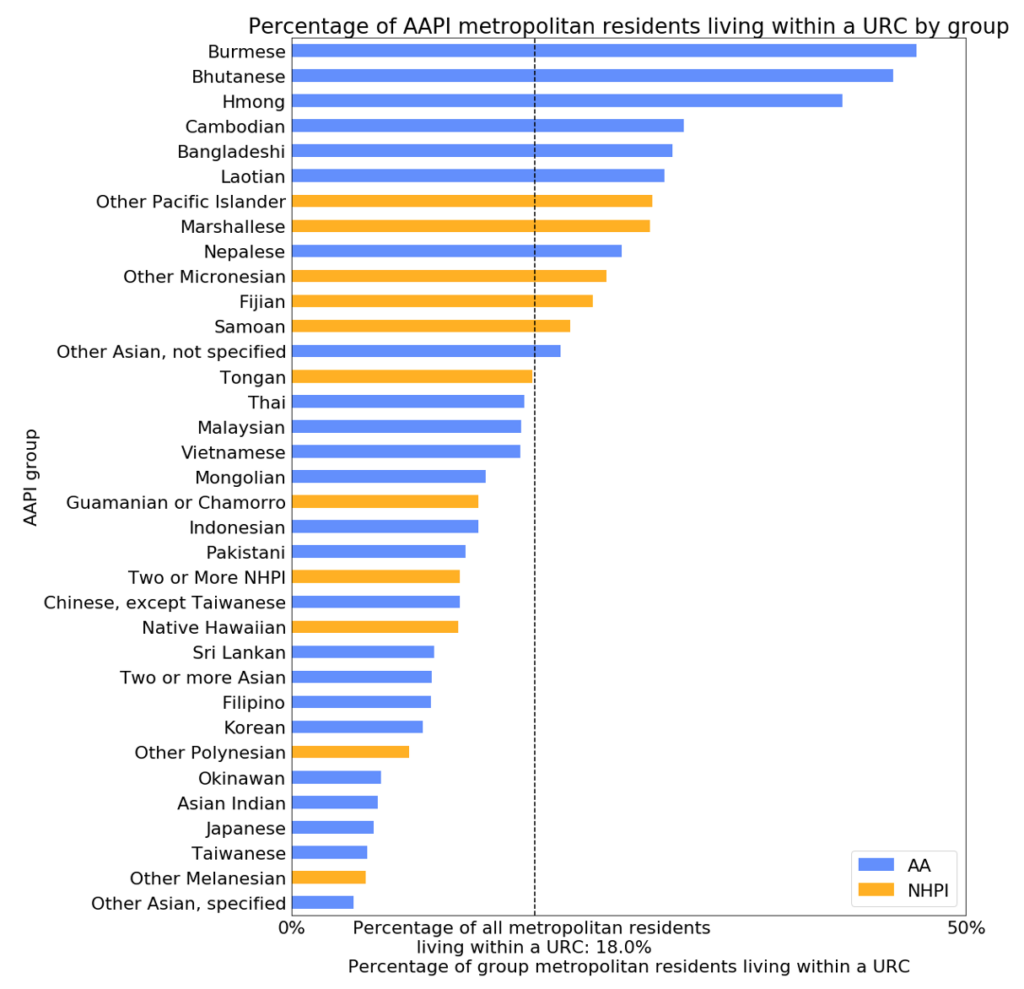
Source: American Community Survey 2015-2019 five-year estimates with under-resourced community boundaries as defined by ICIC; excludes multiracial Asians and Native Hawaiians and Pacific Islanders. AAPI groups included in figures 1 and 2 differ because of differences in data sources.
AAPI residents are an especially large percentage of the URC population in some metropolitan areas. Nearly three-quarters (71.7%) of the residents of URCs in metropolitan Honolulu are members of AAPI groups (figure 3), as are more than a third (38.2%) of URC residents in the San Jose area and nearly a fifth (19.9%) in the San Francisco area. AAPI residents are also more than a tenth of the URC population in the Sacramento, Minneapolis, Seattle, Stockton, Utica (NY), Anchorage, Vallejo (CA), Atlantic City, Fresno, and Portland (OR) metro areas.
Figure 3. High percentages of Asian Americans (AA) and Native Hawaiians and Pacific Islanders (NHPI) live in the URC of Honolulu, both greater than their respective metro percentages.
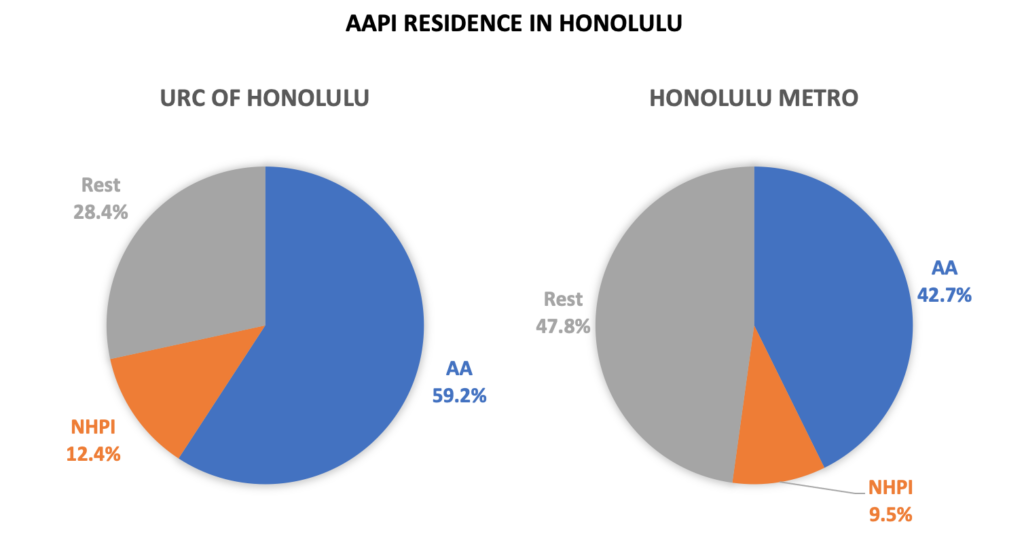
Source: American Community Survey 2015-2019 five-year estimates with under-resourced community boundaries as defined by ICIC; excludes multiracial Asians and Native Hawaiians and Pacific Islanders.
Even where AAPI residents are a smaller percentage of the overall URC population, some URC neighborhoods have many AAPI residents and AAPI-owned businesses, both important contributors to under-resourced community economies. Some, like the Chinatowns of Boston, Philadelphia, Chicago, San Francisco, Oakland, and Los Angeles (among others), have culturally and linguistically defined boundaries and are home to several different AAPI groups. South East Fort Wayne, IN, has a large Burmese population.
Understanding Differences Among AAPI Groups is Crucial for Economic Development Policy and Strategy
My grandfather Yee was a serial entrepreneur, starting a Chinese language school, then owning and operating a laundry and corner store. An immigrant from China to Trinidad and Tobago and then to the United States, his needs as a business owner, such as language accessible business technical assistance programs, were reflective of his experiences. Though language accessibility is a need shared by several other AAPI groups, as I will discuss later, a deep understanding of differences among AAPI groups is crucial to develop inclusive economic development policy and strategy. My grandfather’s struggles as an East Asian immigrant are resonant, though not universal.
In URCs where AAPI residents are an important part of the population, economic development programs and policies must consider their goals and needs. But in doing so, those who design and implement programs and policies must recognize that Asian Americans and Native Hawaiians, and Pacific Islanders are not a monolith and should not be thought of as a homogeneous group of people with a single set of goals and needs. As I’ve shown, AAPI groups differ in poverty and under-resourced community residence rates. But they also differ in language, culture, history of immigration and incorporation, wealth, education, occupation, and immigration status, among other things.
To ensure that programs and policies recognize these differences, program sponsors and policymakers first need timely, culturally relevant, ethnically disaggregated data about the AAPI residents who live in the URCs they care about. Federal data can be helpful but that information isn’t always ethnically disaggregated as it should be. As I’ve argued, combining all Asian Americans and Native Hawaiians, and Pacific Islanders into a single group erases important differences. In addition to informing programs and policies, disaggregated data can provide insights that can help different AAPI groups collaborate and form coalitions.
Language accessibility is an important component of effective economic development and small business technical assistance programs in URCs whose residents have limited English language proficiency. Some Asian communities have very high percentages of their population with language needs. According to a 2022 AAPI Data report, the top five Asian groups with language assistance needs are Bhutanese, Burmese, Vietnamese, Nepalese, and Bangladeshis; from 45% to 65% of the members of each of these groups have language assistance needs. Programs can’t effectively serve communities such as these unless they’re language-accessible. Just as important, community members can’t easily influence the design of programs and policies unless they can participate in the design process in a language they understand. Local organizations can be key partners, building on deep ties and trust within their community as well as language skills to create synergy between community members and public, private, and nonprofit organizations aiming to improve the material conditions of people living in URCs.
In addition to linguistic differences, intergroup differences in goals and needs matter for URC economic development policies and programs. ICIC has argued that place-based efforts such as comprehensive economic development strategies and Opportunity Zones can create economic opportunities for URC residents only if residents are involved in decision-making and investments reflect their priorities. Involving residents and working to meet their priorities requires taking account of differences among groups. It’s not enough, for example, to include members of just one AAPI group on a program advisory council in an AAPI community if the community includes residents of multiple AAPI groups. Likewise, it’s not enough to involve just one AAPI community organization in decision-making if the members of a single AAPI group dominate the organization.
Finally, differences between groups living in different URCs can reflect, in part, the economic geography of the URCs. For example, Honolulu’s URC may face unique challenges as part of an island economy, with higher prices for groceries and electricity and more difficulty integrating under-resourced community business growth with mainland economies. These features of Honolulu’s economic geography can make small business development more difficult in Honolulu’s URC than in other URCs. Combined with longstanding discrimination against Native Hawaiians dating back to the overthrow of the Native Hawaiian government and the U.S. annexation of Hawaii in the 1890s, it may contribute to the high poverty rate of Native Hawaiians, many of whom live in Honolulu.
The Model Minority Myth Impedes Economic Development Policy in Under-Resourced AAPI Communities
The Asian and Native Hawaiian and Pacific Islander diaspora is an extremely diverse group. Not all members of the AAPI community are wealthy, and not all live in rich suburbs. Many members of specific AAPI ethnic groups live in URCs. Policies and programs designed to improve the material lives of people living in concentrated poverty should consider these differences. Not only do policymakers need to know who these communities are as well as other key characteristics of their communities, such as language needs and systems of business financing, the diverse voices of under-resourced Asian Americans and Native Hawaiians and Pacific Islanders must have power and be at the table to develop and implement economic development policies and strategies.
The model minority myth denies these fundamental truths about AAPI communities in the United States. Treating all AAPI people as wealthy diverts the attention of policymakers and non-AAPI people away from the needs and potential of those who are poor. Treating the AAPI community as homogeneous makes it impossible to see the differences in language and other group characteristics that matter for the successful design and implementation of policy and makes it difficult for distinct AAPI groups to gain the power they need to influence policy. In these ways, the model minority myth hinders economic development policy in under-resourced AAPI communities.
I feel a responsibility to make the dream of America held by my father, grandfather, and grandmother a reality. The dream of the United States as a land of golden opportunity is one that we can all struggle towards, even if it may never exactly fit their vision. Shedding light on the diversity among AAPI communities so that AAPI groups that are poor are not forgotten in economic development policies and strategies is one step we can collectively take toward creating more equitable and just economies.
Resources
For information on best practices and guiding principles for data collection within AAPI communities, AAPI Data provides a comprehensive road map to disaggregating data on Asian Americans and Native Hawaiians and Pacific Islanders for federal agencies.