
Back

Blog
In Search of For-profit Anchors
By Peter Eberhardt, Senior Research Analyst, Initiative for a Competitive Inner City, and Howard Wial, Senior Vice President and Director of Research, Initiative for a Competitive Inner City, October 2021
Although many large or otherwise influential for-profit companies make charitable donations that benefit local communities where they do business, they are not in business to address community-level challenges. But a few of those companies are rooted in the local communities where they do business and participate in activities meant to benefit those communities. Those companies, which we call “for-profit anchor institutions,” are the subject of a new ICIC report, made possible by funding from the Robert Wood Johnson Foundation, that shows how for-profit companies can become anchor institutions and how local governments, foundations, and other nonprofit organizations can help them do so. The report, The New Anchors: Corporate Engagement with Lower-Income Communities in Smaller Cities, focuses on lower-income neighborhoods (those with median household incomes below the medians for their respective metropolitan areas) because they face the greatest health, economic development, and quality of life challenges, which the coronavirus crisis has only exacerbated. It focuses on cities with populations below 500,000 because those are the places where most Americans live.
To develop its recommendations for companies, policymakers, and practitioners, the report profiles for-profit anchors in four smaller cities (Amarillo, TX; Fort Wayne, IN; Richmond, VA; and Syracuse, NY), documenting what they do to engage with local lower-income communities and why they do what they do. But it doesn’t tell you how to find the companies that are or might be able to become anchors, which is what policymakers and practitioners interested in getting more companies to become anchors want to do. This blogpost takes the first steps to help do that
Which Companies Could Be For-profit Anchors and How Many of Them Are There?
Let’s start by defining and counting the companies that are or might be able to become anchors.
What kinds of companies have the potential to be for-profit anchors?
To identify companies that could potentially act as anchors (“potential for-profit anchors”), we look first for companies that are sufficiently large (or at least sufficiently influential in a city or region) and rooted in their communities. Specifically, we’re interested in for-profit business establishments with at least 500 employees, or corporate headquarters of any size, that have been present at the same location for at least five years. (We consider stand-alone corporate headquarters to be influential enough in the local area to qualify as anchors even if they have fewer than 500 employees.).
Because we’re interested in businesses that are located in lower-income neighborhoods of smaller cities, we look only at for-profit establishments that are located in:
- Municipalities or unincorporated places with populations under 500,000.
- Metropolitan areas of any size. (Even big metro areas such as New York, Los Angeles, and Chicago, where every city except New York City, Los Angeles, and Chicago themselves count as smaller cities).
- Neighborhoods with a median household income below the median for their respective metropolitan areas.
Businesses whose locations meet all three of these geographic criteria as well as our size or headquarters criteria could potentially be for-profit anchors. Of course, we don’t know whether they’re actually for-profit anchors because we don’t know whether they’re doing anything to benefit their communities. But finding the companies that might be able to become anchors is the first step toward finding anchors or companies that might be interested in becoming anchors.
How many potential for-profit anchors are located in the lower-income neighborhoods of smaller cities?
In 2018, the most recent year for which data were available when we began our report, there were 13,921 for-profit anchors located in lower-income neighborhoods of smaller cities in the 382 U.S. metropolitan areas for which we had complete information. Those anchors made up less than half of one percent of all business establishments in those neighborhoods. They had a total of about 3.6 million jobs, or about 7.1 percent of all jobs in those neighborhoods. For-profit anchors in lower-income neighborhoods of smaller cities are, therefore, responsible for a much larger share of employment than their business establishment presence might suggest. This means that the decisions that these companies make about whether and how they can hire more local residents can have a particularly large impact on lower-income communities.
Where Can You Find the Companies That Could Be For-profit Anchors?
Potential for-profit anchors are located in the lower-income neighborhoods of smaller cities throughout metropolitan America. All 382 metropolitan areas for which we have information have at least one of these companies. But the metro areas that have the most are generally:
- Larger
- Higher-income (even though the companies are located in the lower-income neighborhoods of the metro area).
- Better educated.
- In the Northeast and Midwest.
Larger metropolitan areas have more potential for-profit anchors.
As you might expect, large metropolitan areas have more potential for-profit anchors located in the lower-income neighborhoods of their smaller cities than do smaller metro areas (Figure 1). Metropolitan areas with more than 3 million people have an average of 200 potential for-profit anchors in those neighborhoods. By contrast, those with fewer than 250,000 people have an average of only 11.
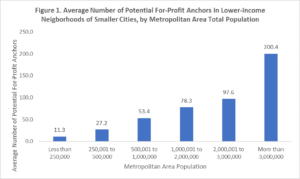
Source: ICIC analysis of 2018 Your-economy Time Series data and U.S. Census Bureau American Community Survey data.
Higher-income metropolitan areas have more for-profit anchors.
Metropolitan areas with higher median household incomes have more potential for-profit anchors in the lower-income neighborhoods of their smaller cities than do lower-income metro areas (Figure 2). Metro areas with median household incomes above $100,000 per year have an average of 172 potential for-profit anchors in those neighborhoods, while those with median household incomes between $30,000 and $40,000 have an average of only 7.

Source: ICIC analysis of 2018 Your-economy Time Series data and U.S. Census Bureau American Community Survey data.
Metropolitan areas in the Northeast and Midwest have more potential for-profit anchors than those in the West and South.
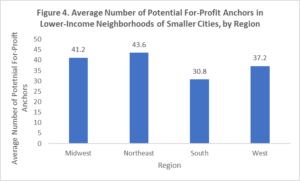
Nationwide, metropolitan areas have an average of 36 potential for-profit anchors in the lower-income neighborhoods of their smaller cities. Metro areas in the Northeast have an average of 44 potential for-profit anchors in these neighborhoods while those in the Midwest have an average of 41 (Figure 4). Metropolitan areas in the West and South have fewer potential for-profit anchors in these neighborhoods (an average of 37 in the West and 31 in the South).

Source: ICIC analysis of 2018 Your-economy Time Series data and U.S. Census Bureau American Community Survey data.
Metropolitan areas in the Northeast and Midwest have more potential for-profit anchors than those in the West and South.
Nationwide, metropolitan areas have an average of 36 potential for-profit anchors in the lower-income neighborhoods of their smaller cities. Metro areas in the Northeast have an average of 44 potential for-profit anchors in these neighborhoods while those in the Midwest have an average of 41 (Figure 4). Metropolitan areas in the West and South have fewer potential for-profit anchors in these neighborhoods (an average of 37 in the West and 31 in the South).
Source: ICIC analyses of 2018 Your-economy Time Series data and U.S. Census Bureau American Community Survey data.
The Midwest is also the only region of the country where potential for-profit anchors are larger than the national average. Potential for-profit anchors in the Midwest have an average of 296 employees. Those in the South, Northeast, and West have fewer employees on average (246 employees, 243 employees, and 232 employees, respectively).
Where Are Potential For-profit Anchors Most Important as Employers?
One way large companies can benefit lower-income communities is by hiring their residents, preferably for good jobs or jobs with good opportunities for advancement. A very rough way of measuring the importance of potential for-profit anchors in generating jobs is to look at the percentage of all jobs in lower-income neighborhoods of smaller cities that are in those businesses. When we do that, we find that:
- Potential for-profit anchors are more important employers in smaller metropolitan areas.
- They are more important as employers in the Midwest than in other regions.
- Among potential for-profit anchors, large non-headquarters establishments are most important as employers, especially in the South and West.
Potential for-profit anchors are responsible for a higher percentage of jobs in smaller metropolitan areas.
Among the 382 metropolitan areas we examined, the share of jobs in small-city lower-income neighborhoods that are at for-profit anchors ranges from 0.1 percent in the Elizabethtown-Fort Knox, KY, and Sebring, FL, to about 37 percent in East Stroudsburg, PA. Overall, there are 26 metropolitan areas where for-profit anchors have at least 15 percent of all jobs in small-city, lower-income neighborhoods (Table 1). With the exception of Las Vegas, where for-profit anchors have 16 percent of all jobs, the metropolitan areas where for-profit anchors have the largest percentages of all jobs have fewer than a million people. Only Las Vegas and Albany (NY) are among the 100 largest metro areas.
Table 1. Metropolitan Areas Where For-profit Anchors’ Percentage of All Jobs in Lower-income Neighborhoods of Smaller Cities Is 15 Percent or More
| Metropolitan Area | Metropolitan Area Population | Percent of Jobs in Lower-Income Neighborhoods of Smaller Cities at Potential For-profit Anchors |
| East Stroudsburg, PA | 167,586 | 37.1% |
| Carson City, NV | 54,467 | 35.1% |
| Trenton, NJ | 368,762 | 28.0% |
| Corvallis, OR | 89,780 | 27.7% |
| Hanford-Corcoran, CA | 150,075 | 27.1% |
| Roanoke, VA | 313,291 | 26.7% |
| Springfield, IL | 210,028 | 24.9% |
| Saginaw, MI | 192,778 | 23.1% |
| Manhattan, KS | 98,841 | 22.8% |
| Fayetteville-Springdale-Rogers, AR-MO | 526,412 | 21.5% |
| Billings, MT | 169,086 | 20.7% |
| Olympia-Tumwater, WA | 274,684 | 19.9% |
| Battle Creek, MI | 134,473 | 19.2% |
| Lynchburg, VA | 260,668 | 18.1% |
| Lansing-East Lansing, MI | 476,615 | 17.5% |
| Iowa City, IA | 169,144 | 17.3% |
| Florence, SC | 205,814 | 16.8% |
| Cedar Rapids, IA | 268,315 | 16.6% |
| Logan, UT-ID | 135,615 | 16.4% |
| Columbia, MO | 176,515 | 15.8% |
| Las Vegas-Henderson-Paradise, NV | 2,141,574 | 15.7% |
| Kokomo, IN | 82,387 | 15.7% |
| Albany-Schenectady-Troy, NY | 880,481 | 15.4% |
| Decatur, IL | 106,512 | 15.4% |
Source: ICIC analysis of 2018 Your-economy Time Series data and U.S. Census Bureau American Community Survey data.
Among metropolitan areas with at least 3 million people, only three (Minneapolis-St. Paul, Houston, and Atlanta) have percentages of for-profit anchor jobs in the lower-income neighborhoods of their smaller cities that are above the national percentage of 7.1 percent (Table 1). At the other extreme, for-profit anchors have less than 4 percent of jobs in the lower-income neighborhoods of smaller-cities in the San Francisco, Miami, and San Diego metro areas.
Table 2. For-profit Anchors’ Percentage of All Jobs in Lower-income Neighborhoods of Smaller Cities in Metropolitan Areas with at least 3 Million People
| Metropolitan Area | Metropolitan Area Population | Percent of Jobs in Lower-Income Neighborhoods of Smaller Cities at Potential For-profit Anchors |
| Minneapolis-St. Paul-Bloomington, MN-WI | 3,557,528 | 12.8% |
| Houston-The Woodlands-Sugar Land, TX | 6,779,104 | 8.8% |
| Atlanta-Sandy Springs-Roswell, GA | 5,779,463 | 8.4% |
| Chicago-Naperville-Elgin, IL-IN-WI | 9,536,428 | 6.5% |
| Phoenix-Mesa-Scottsdale, AZ | 4,673,634 | 6.1% |
| Boston-Cambridge-Newton, MA-NH | 4,811,732 | 5.9% |
| Detroit-Warren-Dearborn, MI | 4,317,179 | 5.9% |
| Philadelphia-Camden-Wilmington, PA-NJ-DE-MD | 6,069,448 | 5.8% |
| New York-Newark-Jersey City, NY-NJ-PA | 3,030,047 | 5.1% |
| Riverside-San Bernardino-Ontario, CA | 19,990,592 | 4.9% |
| Dallas-Fort Worth-Arlington, TX | 4,518,699 | 4.8% |
| Seattle-Tacoma-Bellevue, WA | 7,255,028 | 4.5% |
| Washington-Arlington-Alexandria, DC-VA-MD-WV | 3,809,717 | 4.3% |
| Los Angeles-Long Beach-Anaheim, CA | 6,138,382 | 4.2% |
| San Francisco-Oakland-Hayward, CA | 13,262,234 | 3.8% |
| Miami-Fort Lauderdale-West Palm Beach, FL | 4,673,221 | 3.6% |
| San Diego-Carlsbad, CA | 6,070,944 | 1.3% |
Source: ICIC analysis of 2018 Your-economy Time Series data and U.S. Census Bureau American Community Survey data.
In metropolitan areas where potential for-profit anchors account for a very low percentage of jobs, community and economic development strategies will have to rely on different tools and may need to engage organizations that do not fit our definition of a potential for-profit anchor. But even in metropolitan areas where for-profit anchors have a large employment presence, local policymakers and practitioners should consider whether the large anchor share of jobs results from the presence of a few large companies (as in the Hanford-Corcoran, CA, metropolitan area) or whether it is spread out among a larger number of somewhat smaller companies (as in the metropolitan areas of Carson City, NV; Springfield, IL; and Olympia, WA).
Potential for-profit anchors are responsible for a high percentage of jobs in Midwestern metropolitan areas.
The importance of for-profit anchor organizations as job generators in lower-income neighborhoods of smaller cities varies somewhat by region of the country (Figure 5). The Midwest is the only region in which potential for-profit anchors’ employment share is above the national percentage, with 9.3 percent of jobs at for-profit anchor institutions. The Northeast, West, and South each have lower for-profit anchor employment percentages (7.2 percent, 6.7 percent, and 5.6 percent, respectively).

Source: ICIC analysis of 2018 Your-economy Time Series data and U.S. Census Bureau American Community Survey data.
Large non-headquarters businesses are responsible for more jobs than other types of potential for-profit anchors, especially in the South and West.
Non-headquarters potential anchors with 500 or more employees (“large non-HQ anchors”) account for the largest share (46 percent) of all jobs at potential for-profit anchors nationwide, while corporate headquarters with fewer than 500 employees (“small-HQ anchors”) account for the smallest share (21 percent). (See Figure 6.) Although this pattern holds in all regions of the country, it is especially pronounced in the South and West. Large non-HQ anchors have just over half of all potential for-profit anchor jobs in the West and South but are less important in the Northeast and Midwest. On the other hand, potential anchors that are corporate headquarters with 500 or more employees (“large HQ anchors”) are more important sources of jobs in the Northeast and Midwest (where they have 39 percent of potential for-profit anchor jobs) than in the South and West (where they have only 27 percent). The potential for-profit anchor job percentages of small-HQ anchors vary only slightly among regions.
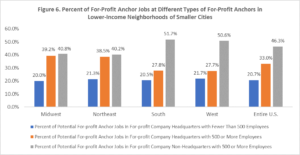
Source: ICIC analysis of 2018 Your-economy Time Series data and U.S. Census Bureau American Community Survey data.
Read the full report: The New Anchors: Corporate Engagement with Lower-Income Communities in Smaller Cities
The Business Dynamics Research Consortium: a project of the University of Wisconsin System, Institute for Business and Entrepreneurship, provided us with the Your-economy Time Series (YTS) data used for the report’s quantitative analysis. Data Axle is the provider of the Licensed Database used to create the Your-economy Time Series (YTS). This research was authorized to use YTS through the Business Dynamics Research Consortium (BDRC) by the UW System’s Institute for Business and Entrepreneurship
Support for ICIC’s research was provided by a grant from the Robert Wood Johnson Foundation; however, the views expressed in the report do not necessarily reflect the views of the Foundation.