
Industrial and Non-Industrial Jobs and Land Use in Saint Paul, MN
Miles Chandler, Senior Research Associate
INTRODUCTION
Like many cities with strong industrial roots, Saint Paul, Minnesota, recognizes the value of protecting its industrial zones and ensuring a future of diverse land use. Light industrial businesses, which include breweries, body shops, and small manufacturers, are vital parts of local business ecosystems and are known to provide high-paying jobs without requiring postsecondary education. While there is value in low barrier-to-entry jobs and the goods and services these businesses offer, negative public perceptions of industrial land use and real estate pressures to convert these properties to residential or retail space often leave the light industry in peril.
From 2022 through 2024, ICIC conducted research sponsored by the Saint Paul Port Authority to demonstrate the ongoing importance of industrial uses to the city’s economy. We employed a diverse set of methods to investigate many facets of the Saint Paul industrial economy, including the fiscal and private economic impacts of different kinds of businesses and land uses, the employment and wages of industrial and non-industrial sectors, and the spatial concentration of employment by industry.
Through this work, we found:
- Properties occupied by light industrial land use in Saint Paul are important players in funding the city budget, returning $1.45 for each dollar the city spends on them.
- Jobs in industrial sectors consistently paid higher average wages than jobs in non-industrial sectors every year from 2008 to 2022.
- Industrial jobs are decentralizing from Saint Paul’s industrial zones and are becoming less concentrated in historic manufacturing hubs across the city.
- Businesses located in the Port Authority’s redevelopment projects (‘business centers’) have an enormous economic impact on the local economy; in 2022, they supported $9.3 billion in economic activity and 43,491 jobs in the city though direct, indirect, and induced spending.
FISCAL IMPACT ANALYSIS
In 2022, ICIC used a “cost of community services” approach to analyze and compare the net fiscal impacts of current land uses on the City of Saint Paul’s budget. This process involves determining how much of the city’s budget was used and how much revenue was generated by different types of land use across the city. By comparing each land use’s revenues and expenditures, we estimated whether, on average, each type of land use contributed more to the city than it used, or required more city resources than it returned.
This analysis yielded several key findings:
- There are very few light industrial parcels in Saint Paul, and these properties both contribute and demand the least city fiscal resources of all the land use types we reviewed.
- Light industrial land uses return $1.45 for each dollar that the city spent on them.
- Light industrial land uses produce the third largest positive net fiscal impact on the city budget and contribute the second largest dollar amount per acre of land (after professional services and heavy industrial).
Using county tax parcel use descriptions and data from the SPPA on leased public properties, we sorted every property in St. Paul into one of eight land use categories: ”light industrial,” ”heavy industrial,” ”professional services,” ”retail,” ”tax exempt,” ”residential,” ”other commercial,” and ”vacant” (Figure 1).
Figure 1: Land Use in Saint Paul, Minnesota (2020).
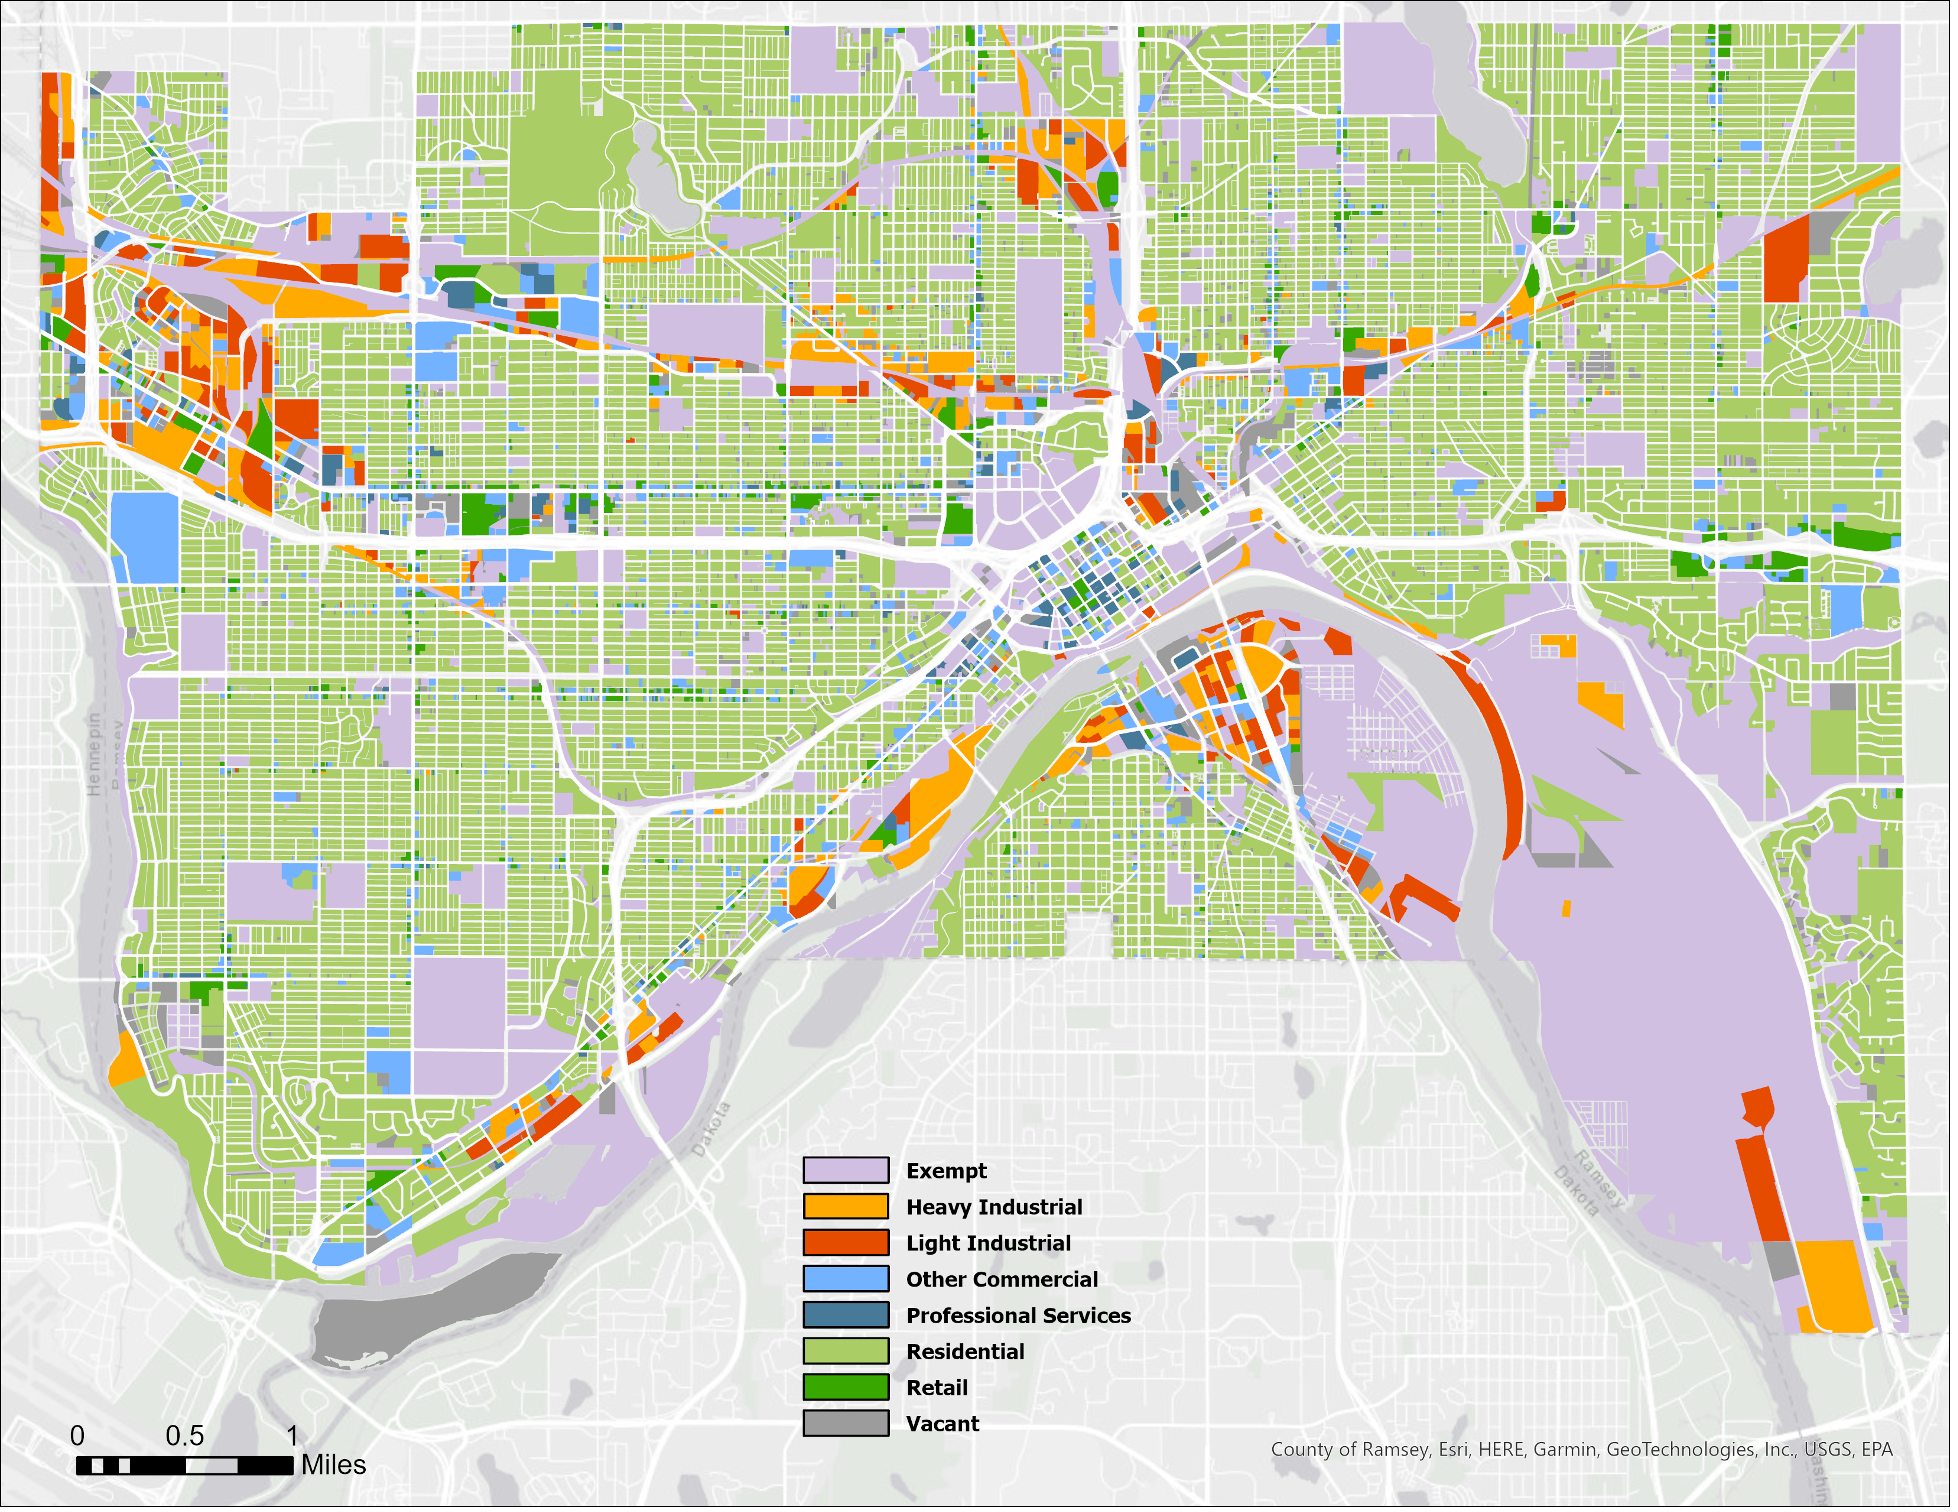
Source: ICIC Analysis of Ramsey County Tax Parcel Data, 2020
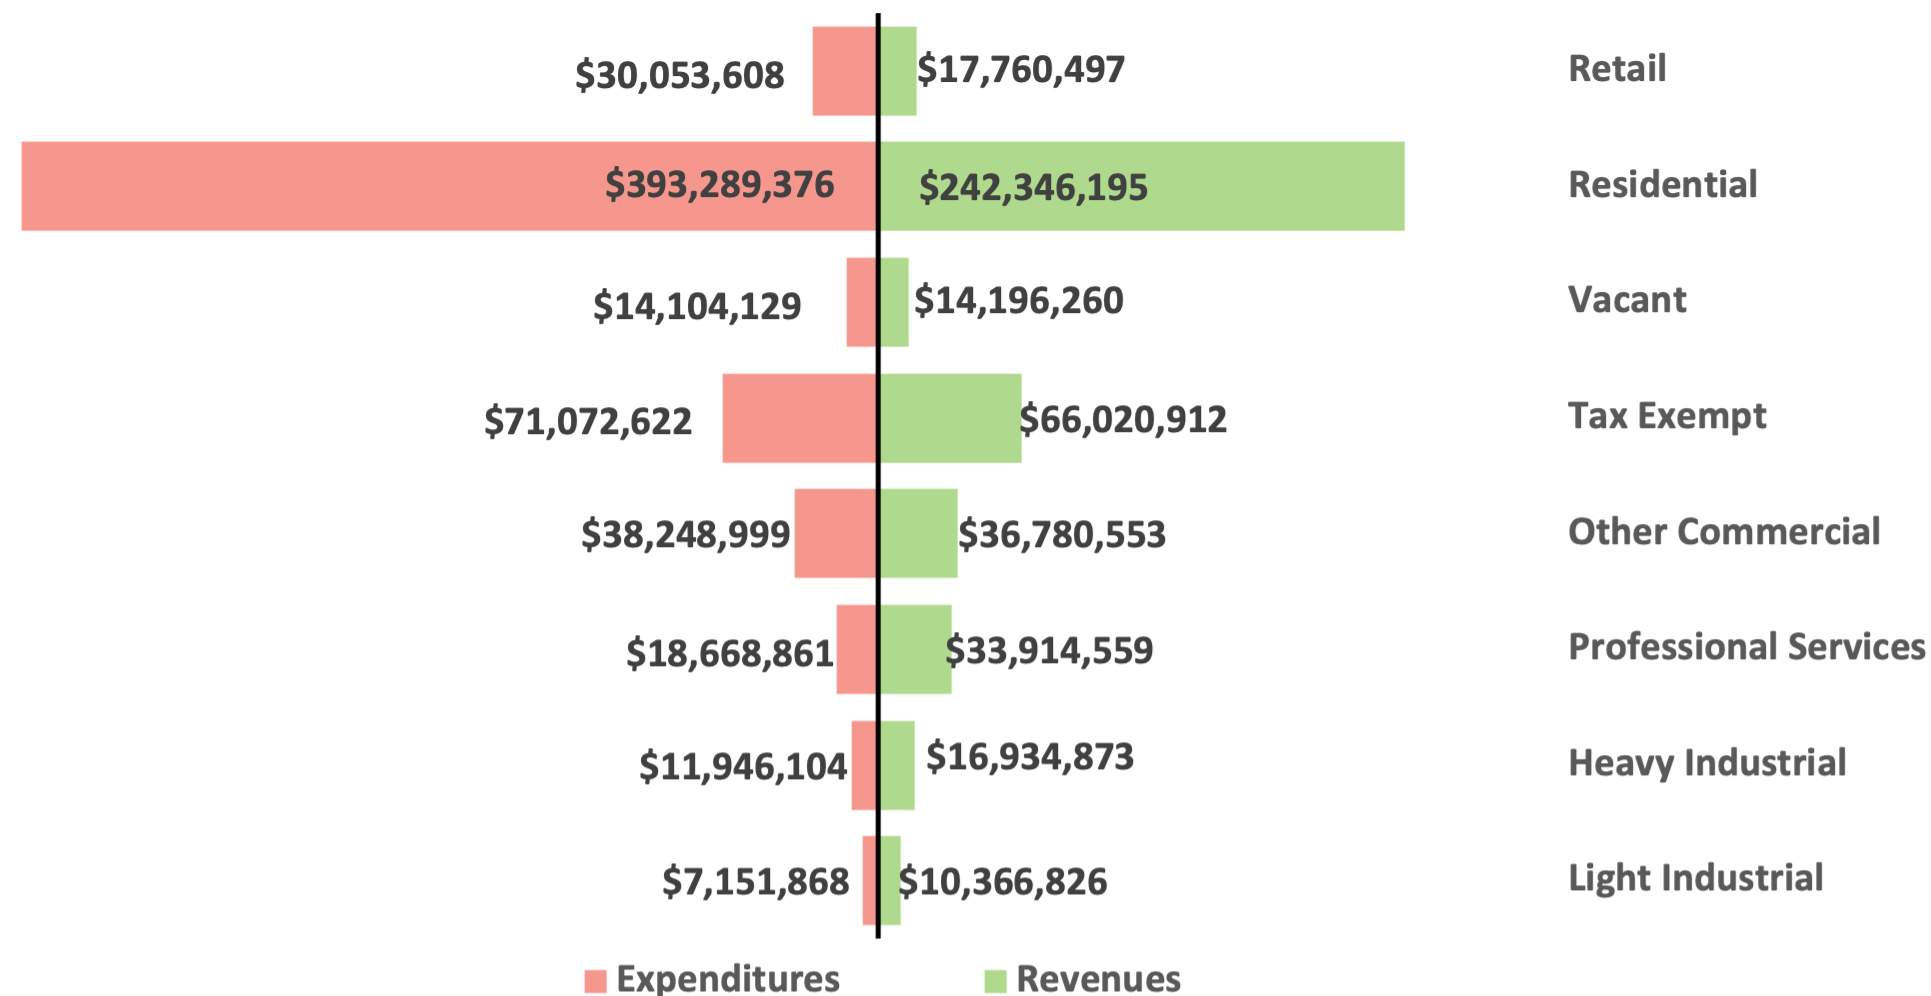
Light industrial land uses contribute the least to and require the least funding from the city. (Figure 2).
Figure 2: Saint Paul City Revenues and Expenditures by Land Use Category (2020)
Light industrial land use produces the second largest return per city dollar spent, behind professional services (Figure 3).
Figure 3: Return Per Dollar Spent for Each Land Use Category (2020)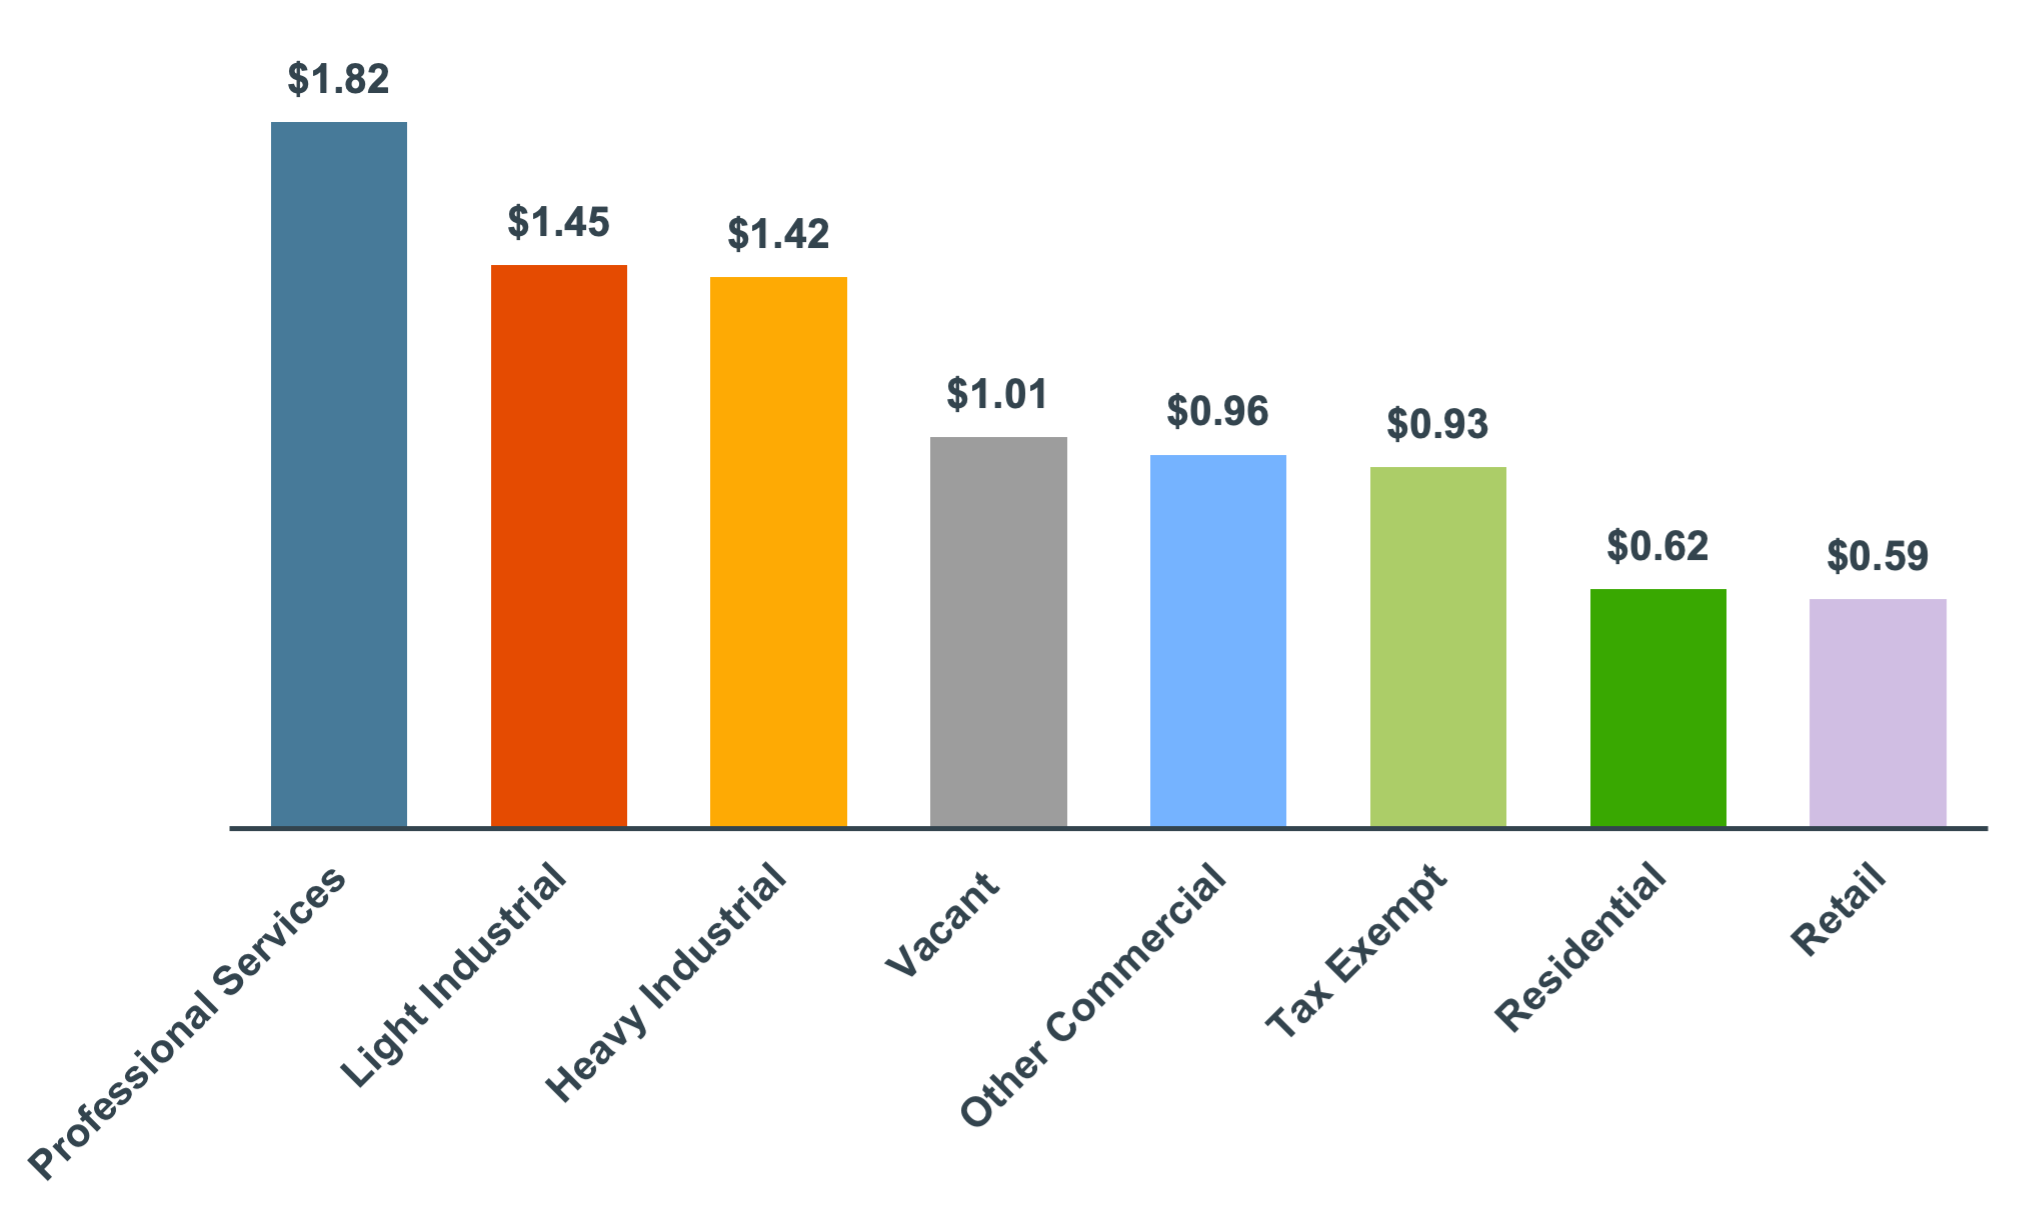
Source: ICIC analysis of Ramsey County tax parcel data (2020), City of Saint Paul budget data (2020), and Saint Paul Police and Fire and Safety Services department data (2020).
Light industrial land use is spatially and fiscally efficient, contributing the second largest amount to the city budget per acre, behind professional services (Figure 4).
Figure 4: Light industrial land use is spatially and fiscally efficient, contributing the second largest amount to the city budget per acre, behind professional services.
Source: ICIC analysis of Ramsey County tax parcel data (2020), City of Saint Paul budget data (2020), Saint Paul Police and Fire and Safety Services department data (2020).
TAX REVENUE AND INDUSTRIAL LAND
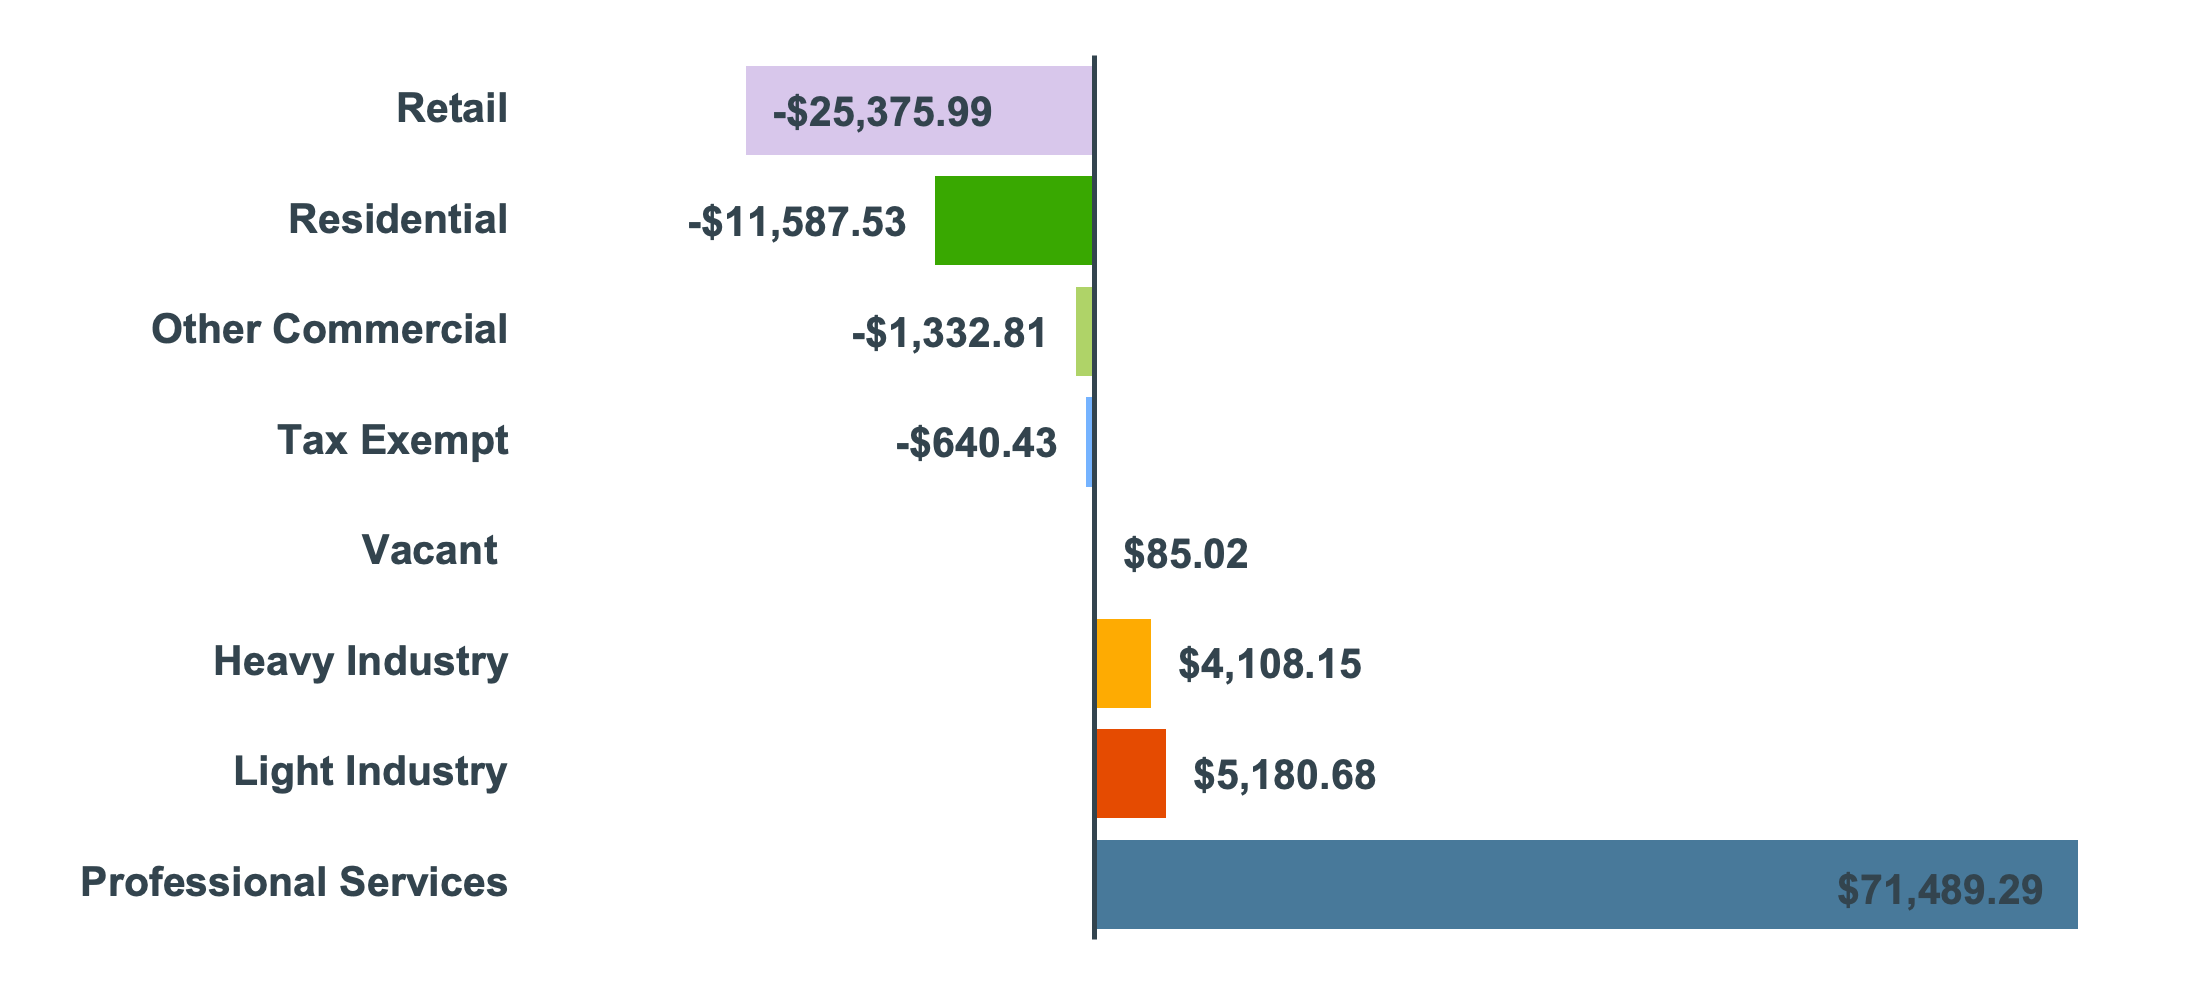
In addition to examining the net fiscal impact of each land use category in Saint Paul, we took a closer look at the impact of property taxes derived from light industrial properties across the city and estimated the amount of this revenue that was used by each department of the City government in 2022.
We found that:
- Light industrial land uses generated $295 million in 2022.
- The largest recipients of this revenue were city departments that support community services, including fire and safety services, police, parks and recreation , and public works.
We combined property tax estimates from multiple sources, including the most recent tax parcel data from Ramsey County and information about taxes paid on leased public properties maintained by the Port Authority.
Using the City’s adopted expense budget from 2022, we identified the percentage of the general fund (which includes all property tax revenue) spent by each department of city government. We used these proportions to estimate the spending of light industrial tax revenue. We estimate that in 2022, light industrial land use generated about $29.5 million in taxes for the City of Saint Paul and that a large majority (over 70 percent) of this tax revenue funded departments responsible for directly responding to community needs, such as police, fire and safety services, public works, and safety and inspection.
Table 1. Spending of Tax Revenue Generated by Light Industry (2022)
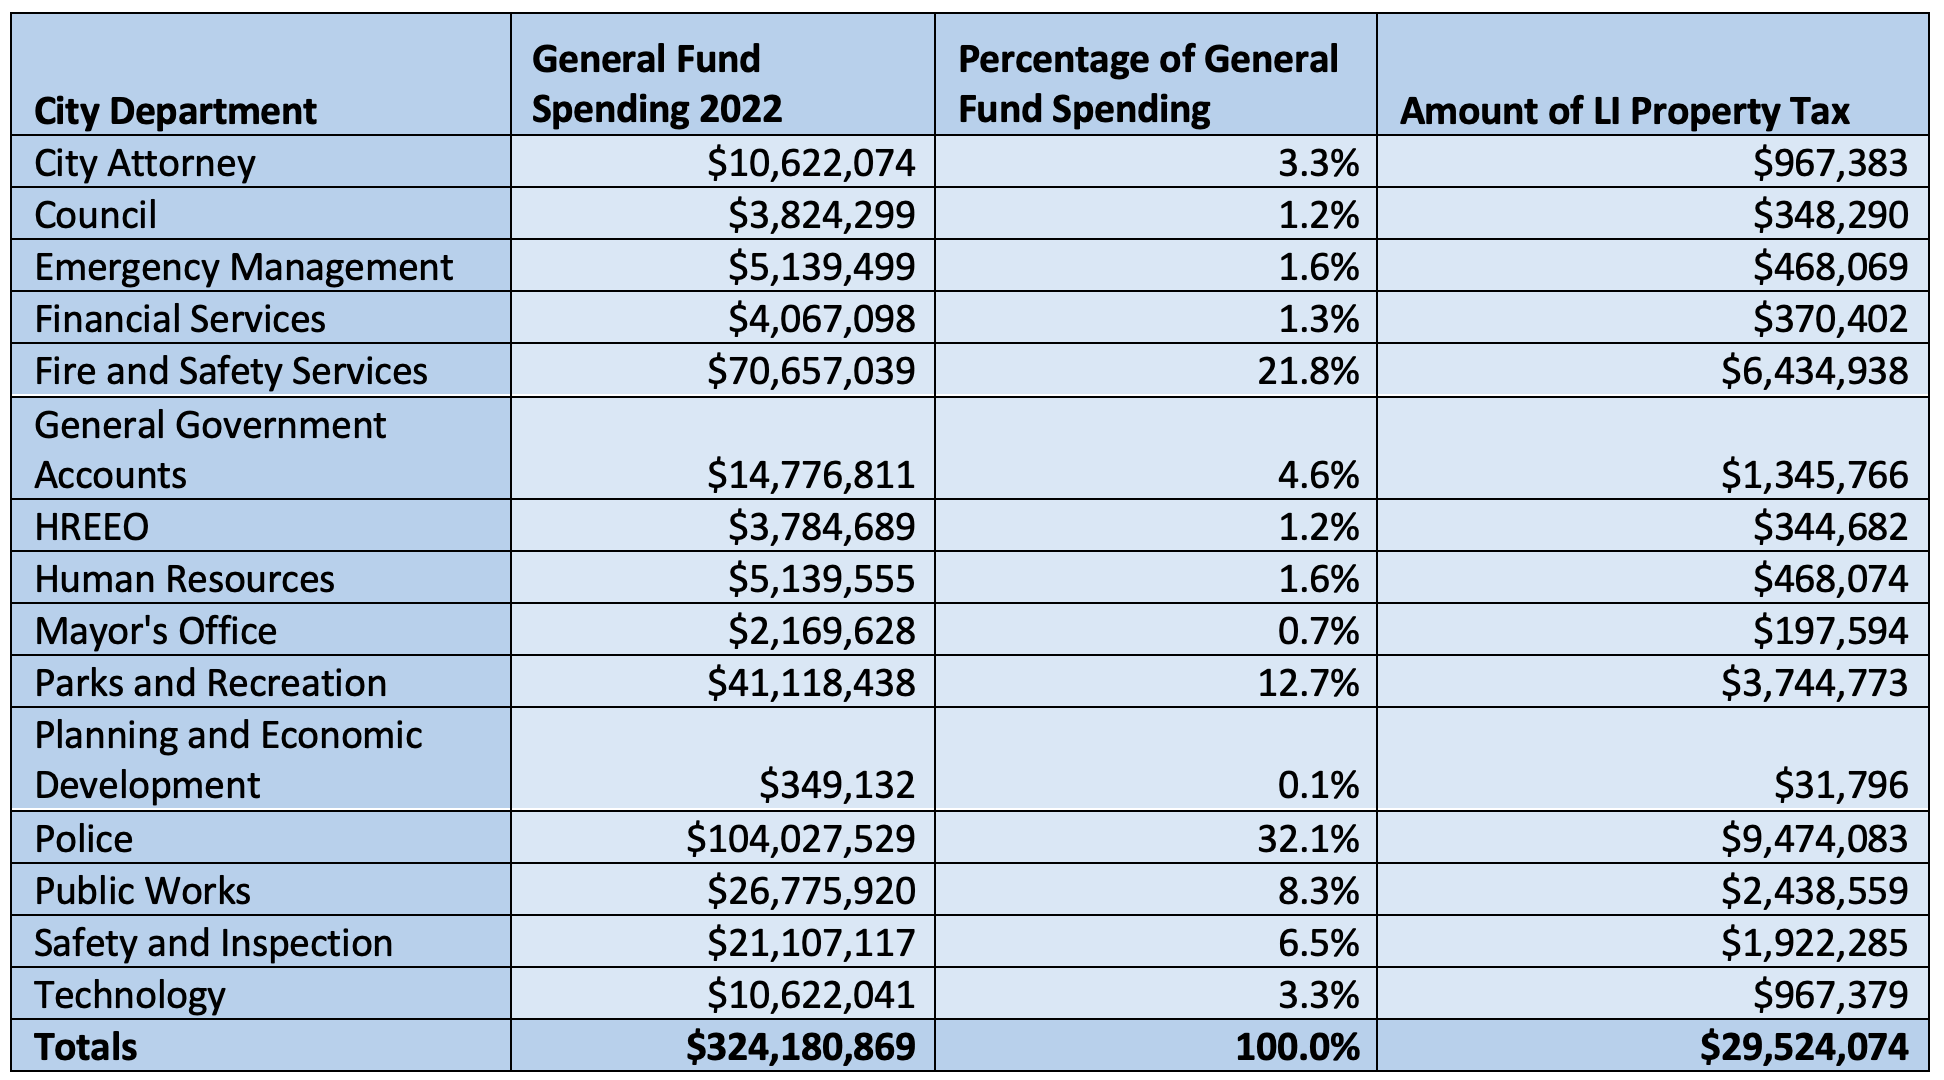
Source: ICIC Analysis of Ramsey County Tax Parcel Data, SPPA Leased Public Property Records, 2022.
We also explored the additional fiscal contributions that industrial properties make as a result of the Minnesota state commercial and industrial tax levy (38.3 percent in 2022). Through this tax, commercial and industrial properties generated around $36 million in state revenue, in addition to the roughly $30 million they contributed to city revenue. This amounts to nearly 4 percent of all revenue collected in 2022 through the commercial and industrial levy statewide, and offsets roughly 11 percent of the $324.5 million that Minnesota contributed to Saint Paul public schools in 2022. These findings further emphasize the outsized role that these properties play in contributing to the fiscal health of the city and the state of Minnesota.
IMPACT OF NON-INDUSTRIAL USES ON INDUSTRIAL LAND
ICIC also conducted research on the ongoing impact of non-industrial uses on Saint Paul’s industrial zones. This work was related to our fiscal impact research, but applied a broader definition of industrial businesses and examined employment and wage trends across all land zoned for industrial uses in the city. We combined zoning information provided by the City of Saint Paul and data on wages and employment from Bureau of Labor Statistics and Census Bureau datasets to analyze annual changes to the landscape of jobs in the city’s industrial zones over the period from 2008 to 2022.
These data allowed us to examine changes to the numbers and percentages of industrial jobs in and outside of Saint Paul’s industrial zones and compare the average wages paid by industrial and non-industrial jobs from 2008 to 2022. We also tracked the spatial concentration of industrial and non-industrial jobs in the City’s industrial zones and investigated changes in the sectoral makeup of non-industrial jobs across the city for the same time period.
Through this work, we found:
- On average, industrial jobs paid higher weekly wages than non-industrial jobs between 2008 and 2022, although the average wages of non-industrial jobs are catching up.
- Industrial jobs are a declining percentage of employment in Saint Paul’s industrial zones and a growing percentage of employment in the rest of the city. This suggests that industrial businesses are decentralizing from the industrial zones.
- In addition to declining slightly in the zones overall, industrial jobs became progressively less concentrated in certain areas of the industrial zones between 2008 and 2020, and spread out more evenly throughout the zones. This is due in part to the closure of several large historic centers of industry in Saint Paul, namely the Ford assembly plant which closed in 2012.
- The non-industrial sectors that saw the greatest job growth between 2008 and 2022 were health care and social assistance, public administration, and educational services.
Wage and Employment Comparisons
Figure 5 shows that:
- Between 2008 and 2020, average weekly wages for industrial businesses (light and heavy combined) in Saint Paul were consistently higher than the average weekly wages of non-industrial jobs.
- However, over the intervening period this gap shrank by more than half; the industrial average wage was 52 percent higher than the non-industrial average in 2008 but only 24 percent higher in 2022.
- This convergence resulted from more rapid growth in non-industrial wages than in industrial wages. Adjusted for inflation, industrial wages rose by about 9 percent (from $1,617 to $1,762 in 2022 dollars) between 2008 and 2022.
- Non-industrial wages experienced a period of strong growth between 2012 and 2015, and then a sustained, slow increase through the early 2020’s; they grew by about 33 percent (from $1,064 to $1,416 in 2022 dollars) between 2008 and 2022.
Figure 5. Average Weekly Industrial and Non-Industrial Wages in Saint Paul, 2008-2022, in 2022 Dollars
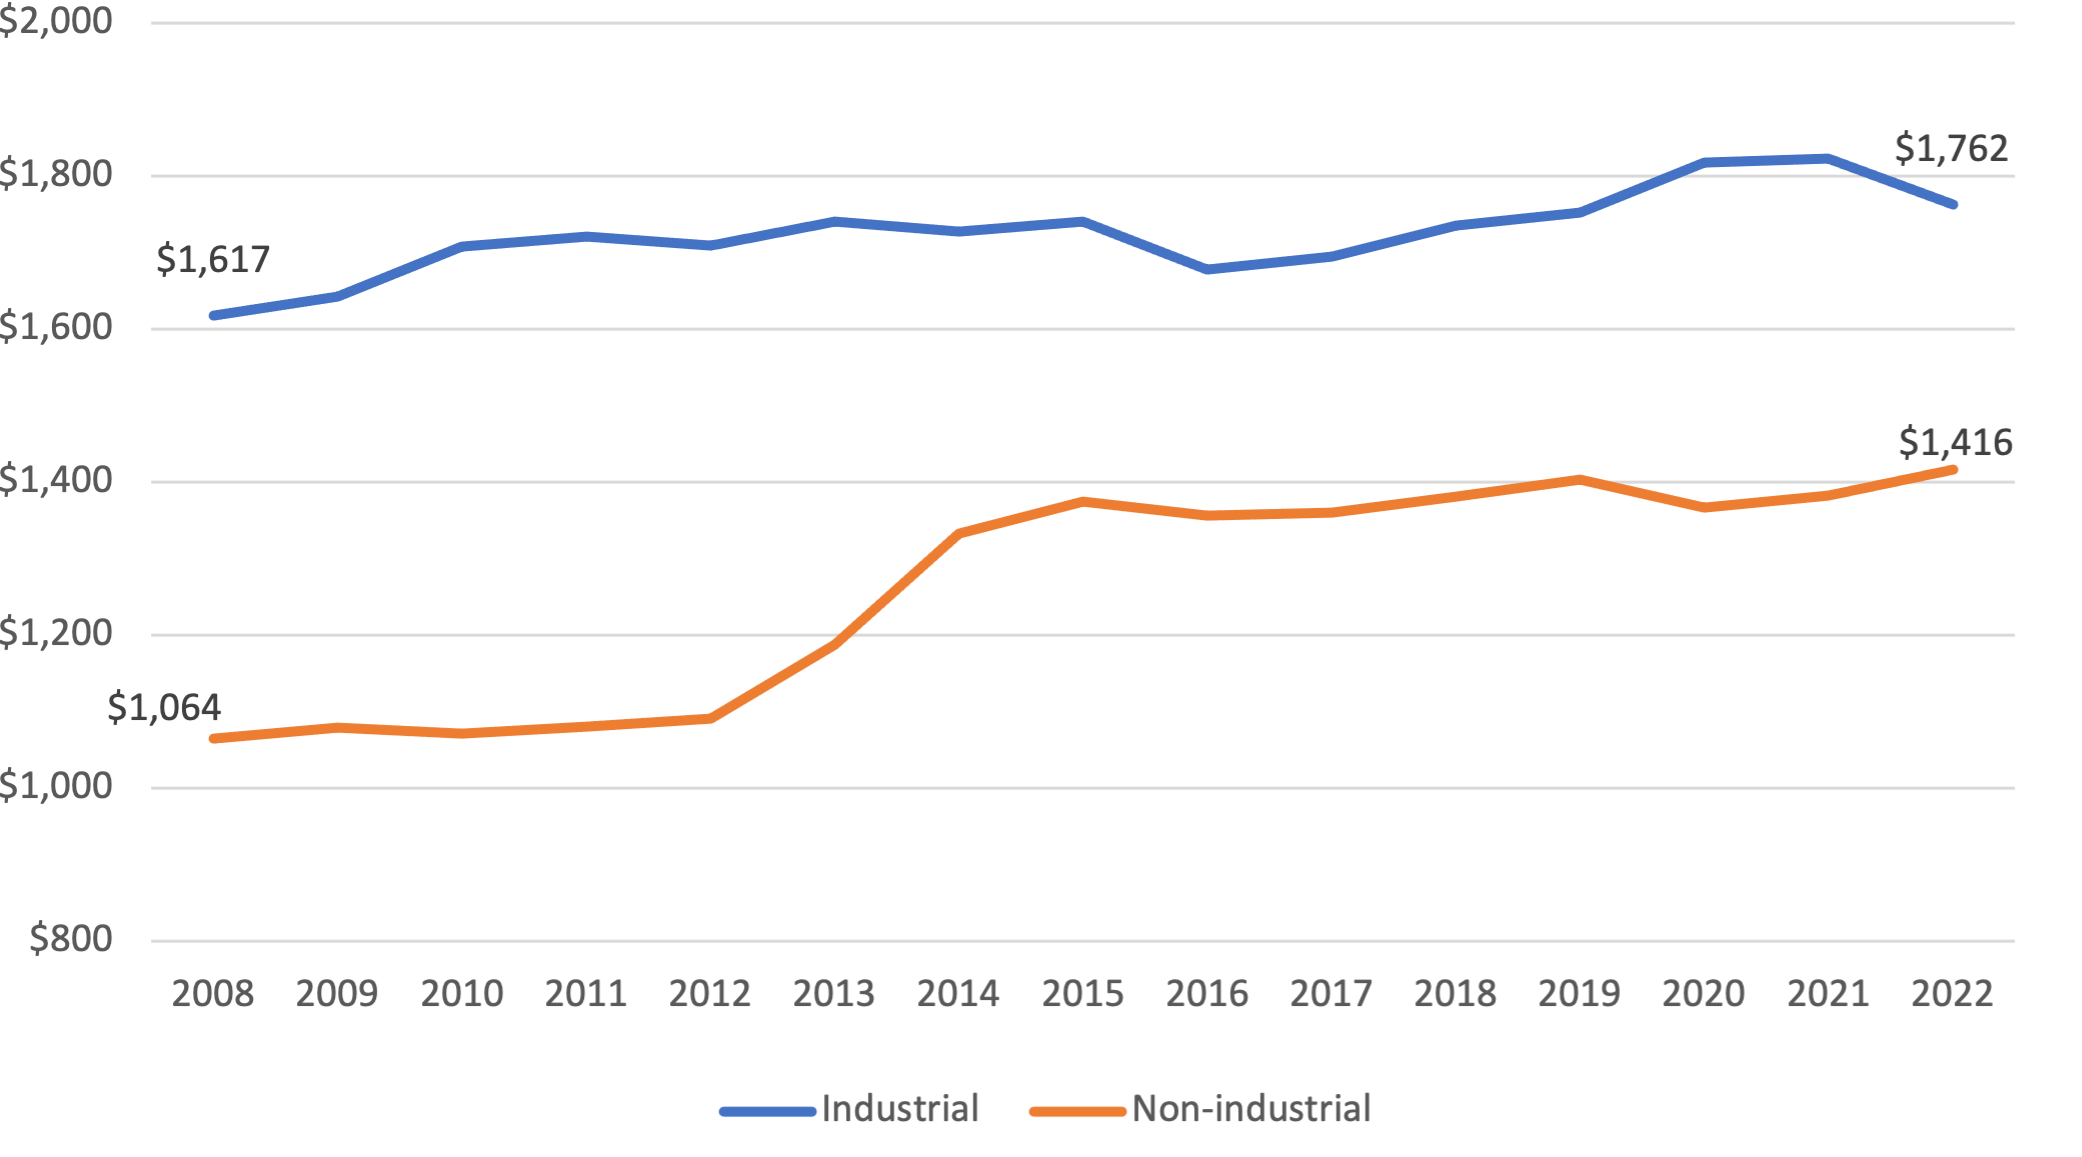
Source: ICIC analysis of Bureau of Labor Statistics Quarterly Census of Employment and Wages, 2008-2022.
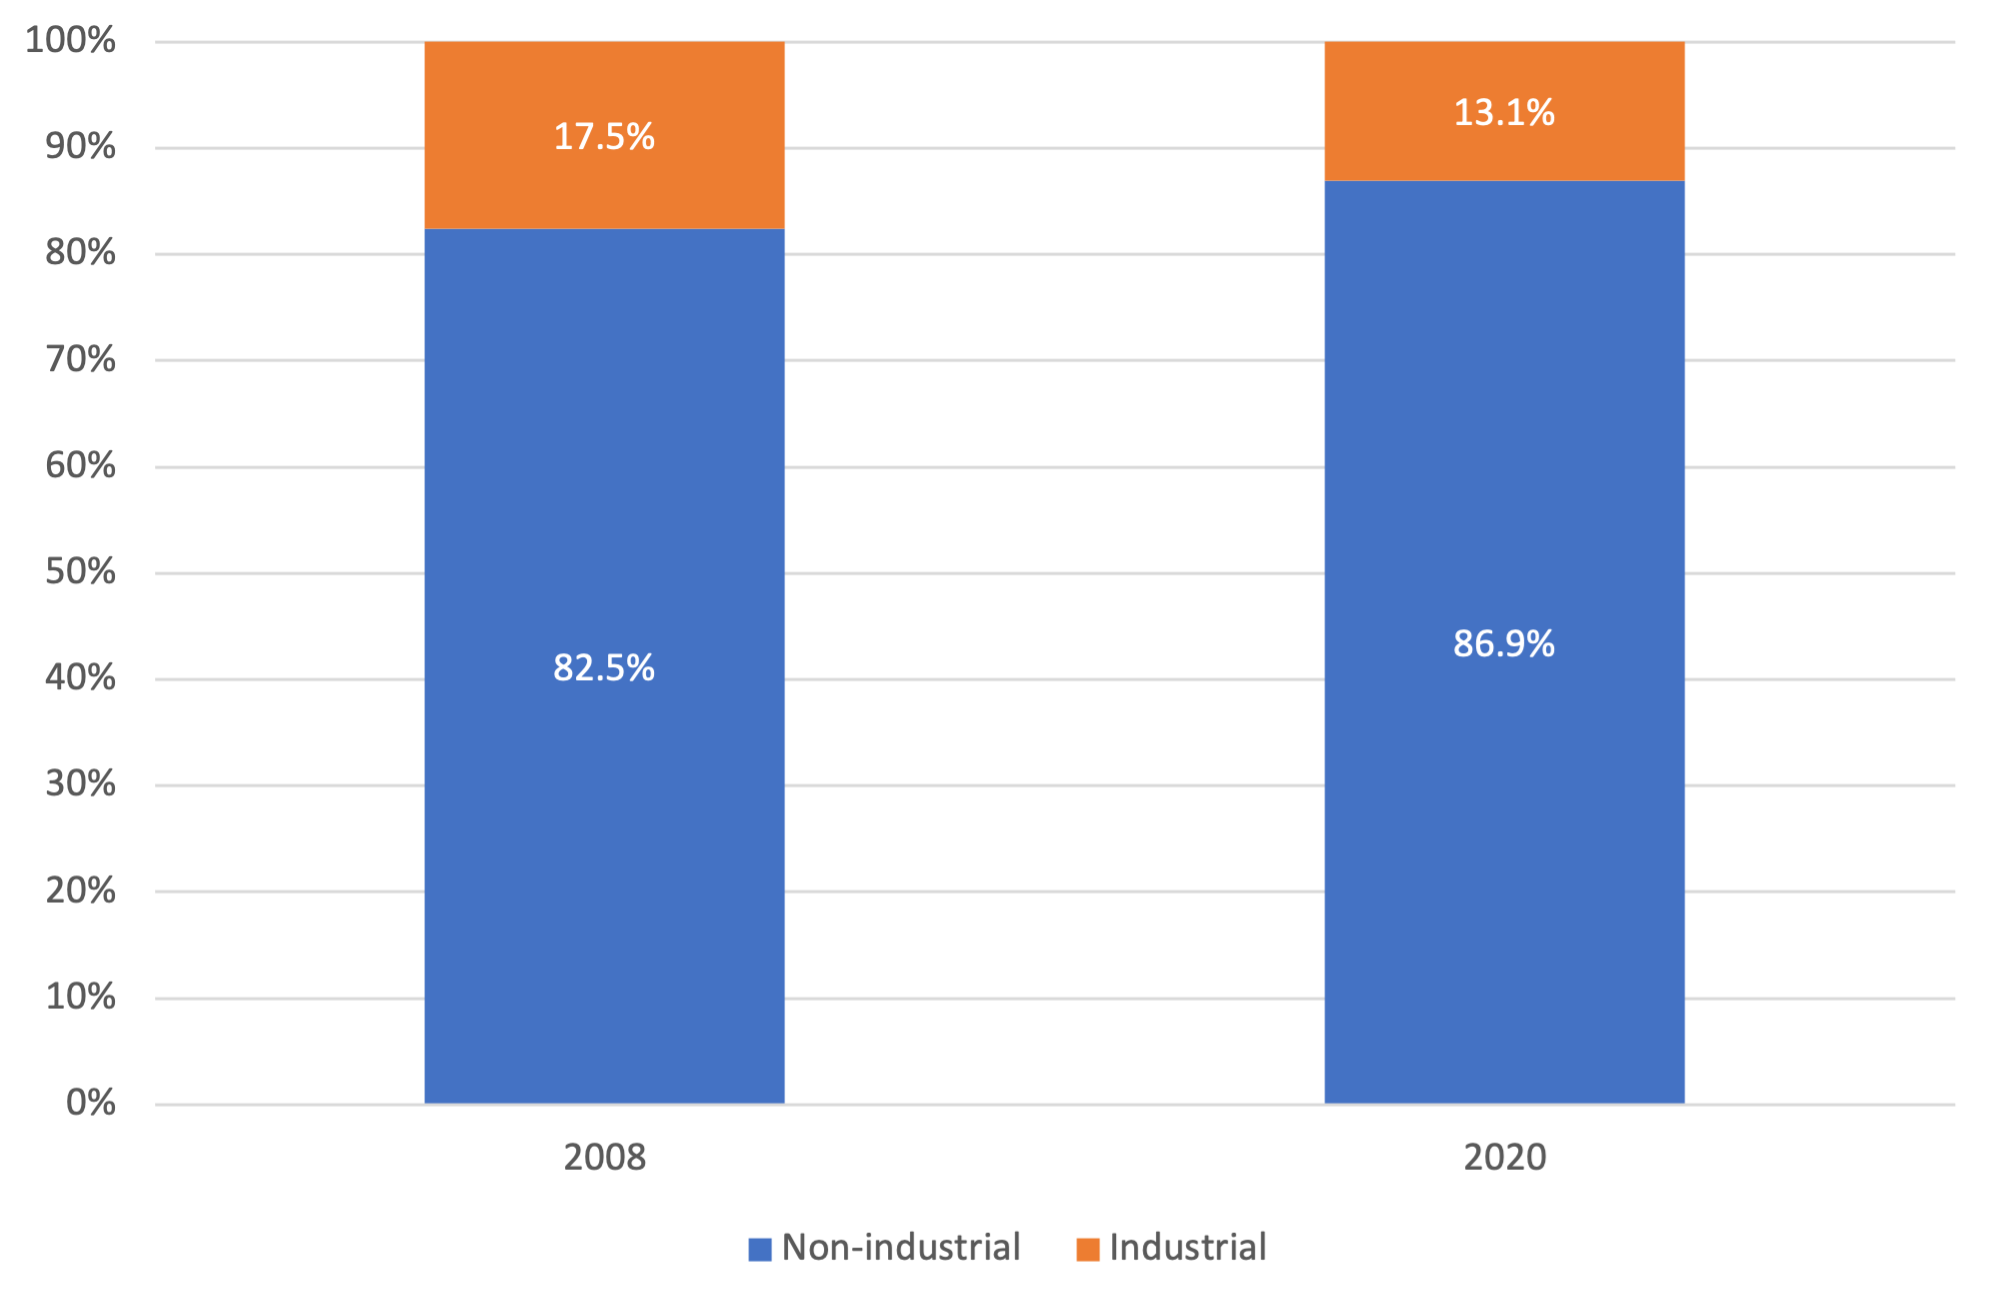
Figure 6 shows that:
- During the period from 2008-2020, industrial jobs were a declining minority of all jobs in Saint Paul’s industrial zones.
- In 2008, the industrial zones had 11,363 industrial jobs, about 17.5 percent of all employment in the industrial zones that year and the greatest number between 2008 and 2020.
- By 2020, industrial employment in the industrial zones had fallen to its lowest level during the 12-year period, 7,844 jobs, which made up 13.1 percent of industrial zone employment in that year.
- In 2008, there were 53,429 non-industrial jobs in the industrial zones. This number grew to 68,468 jobs in 2016 and then fell to 52,198 jobs by 2020, for a net loss of about 2 percent since 2008.
Figure 6. Industrial and Non-Jobs in Saint Paul Industrial Zones, 2008-2020
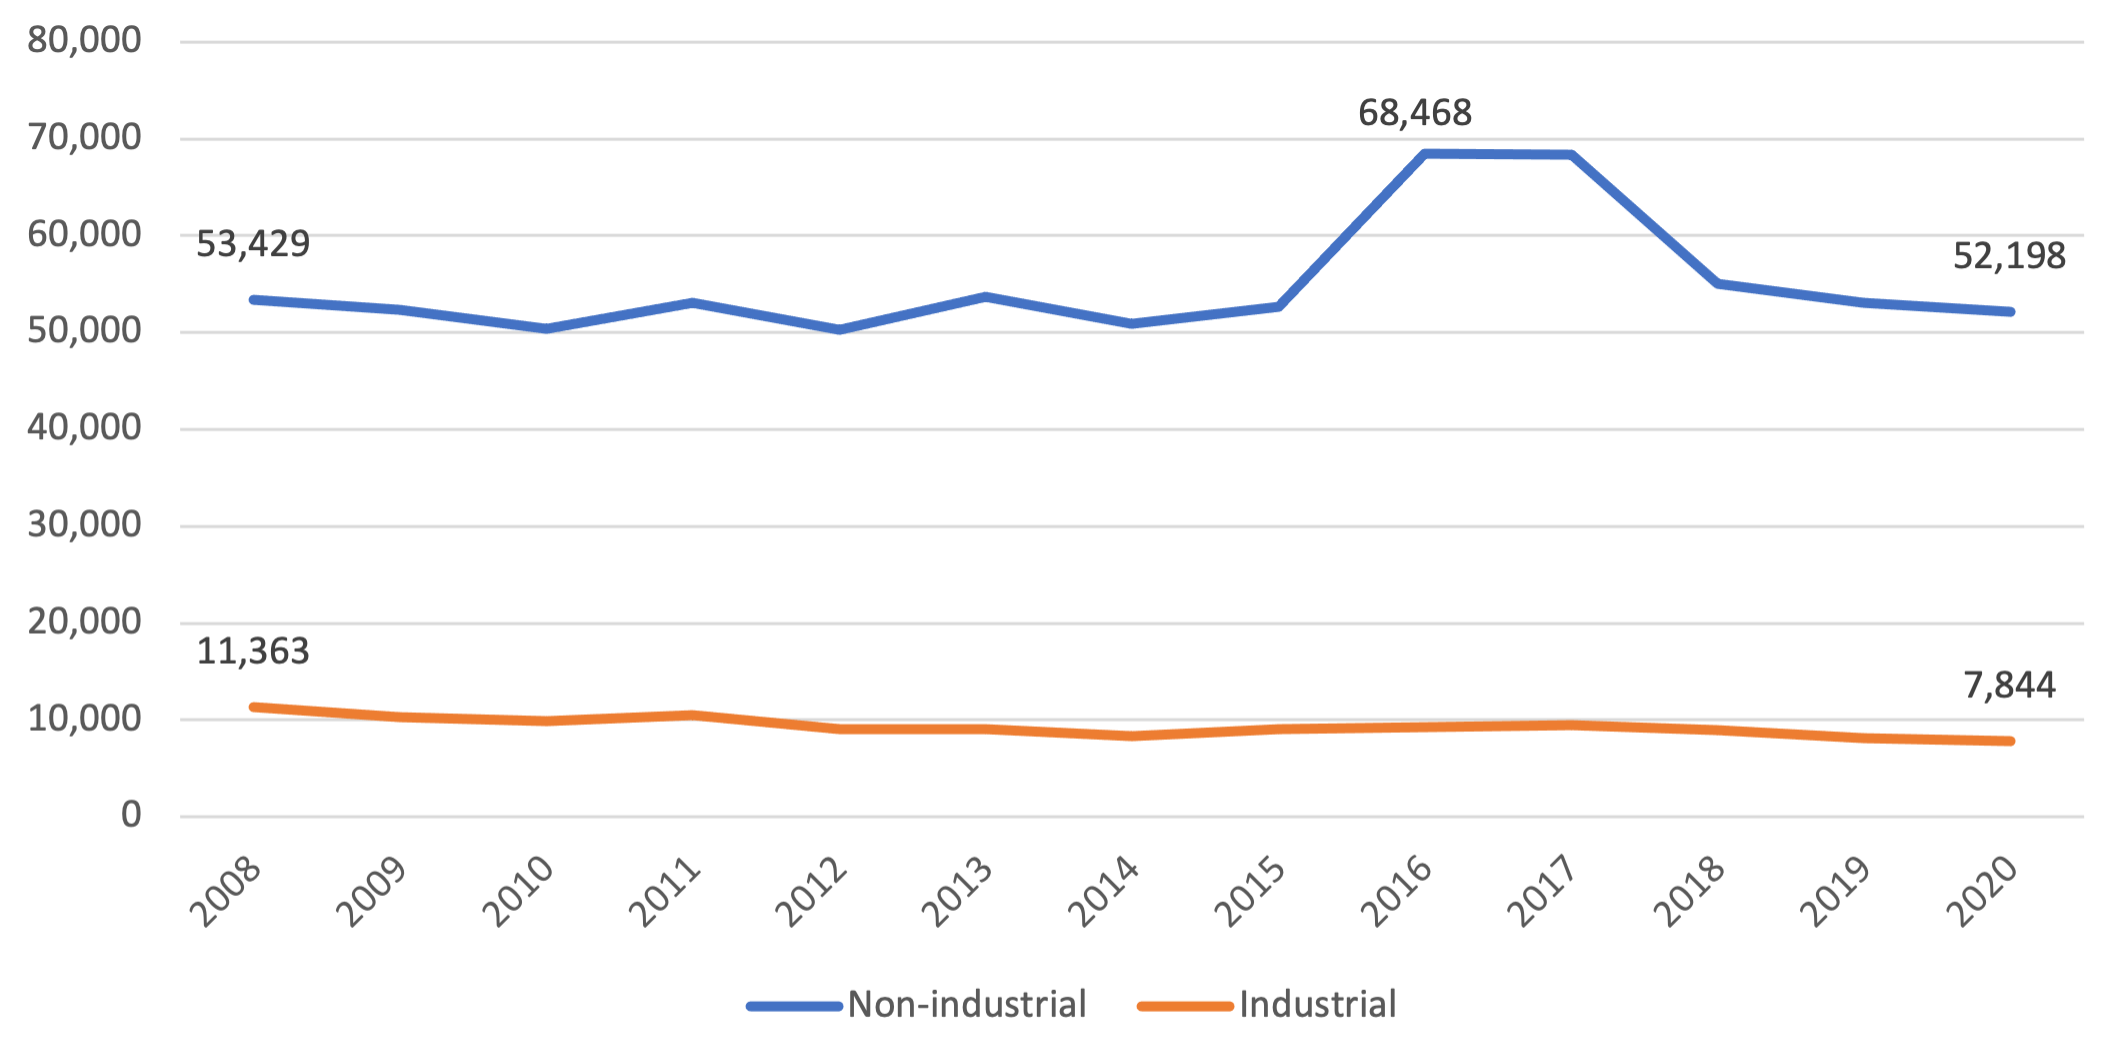
Source: Census Bureau Longitudinal Employment and Household Statistics, 2008-2020.
Comparing the percentage of industrial and non-industrial jobs in the industrial zones from 2008 to 2020, we found that:
- Industrial employment in St. Paul decreased by around 24 percent over the period, while also decentralizing away from the industrial zones (Figure 7).
Figure 7. Industrial and Non-Industrial Employment as Percentage of Total Employment in Industrial Zones, 2008 and 2020
Source: ICIC analysis of Census Bureau Longitudinal Employment and Household Statistics, 2008-2020.
Comparing the percentages of industrial jobs in Sant Paul’s industrial zones with those in the city balance, we found that:
- In 2008, the industrial zones had 91.2 percent of the city’s industrial employment, and the city balance had about 8.8 percent (Figure 8).
- By 2020, the zones had only about 83.5 percent and the city balance had 16.5 percent.
- These changes represent an increase in industrial employment of about 50 percent outside the zones and a 30 percent decrease in industrial employment inside the zones.
- Although industrial jobs outside the industrial zones (hereafter called the “city balance”) were only a small percentage of industrial employment in Saint Paul between 2008 and 2020, the number of those jobs grew significantly over these 12 years, while industrial employment in the zones fell.
Figure 8. Jobs in Industrial Zones and City Balance as Percent of All Industrial Jobs, 2008 and 2020
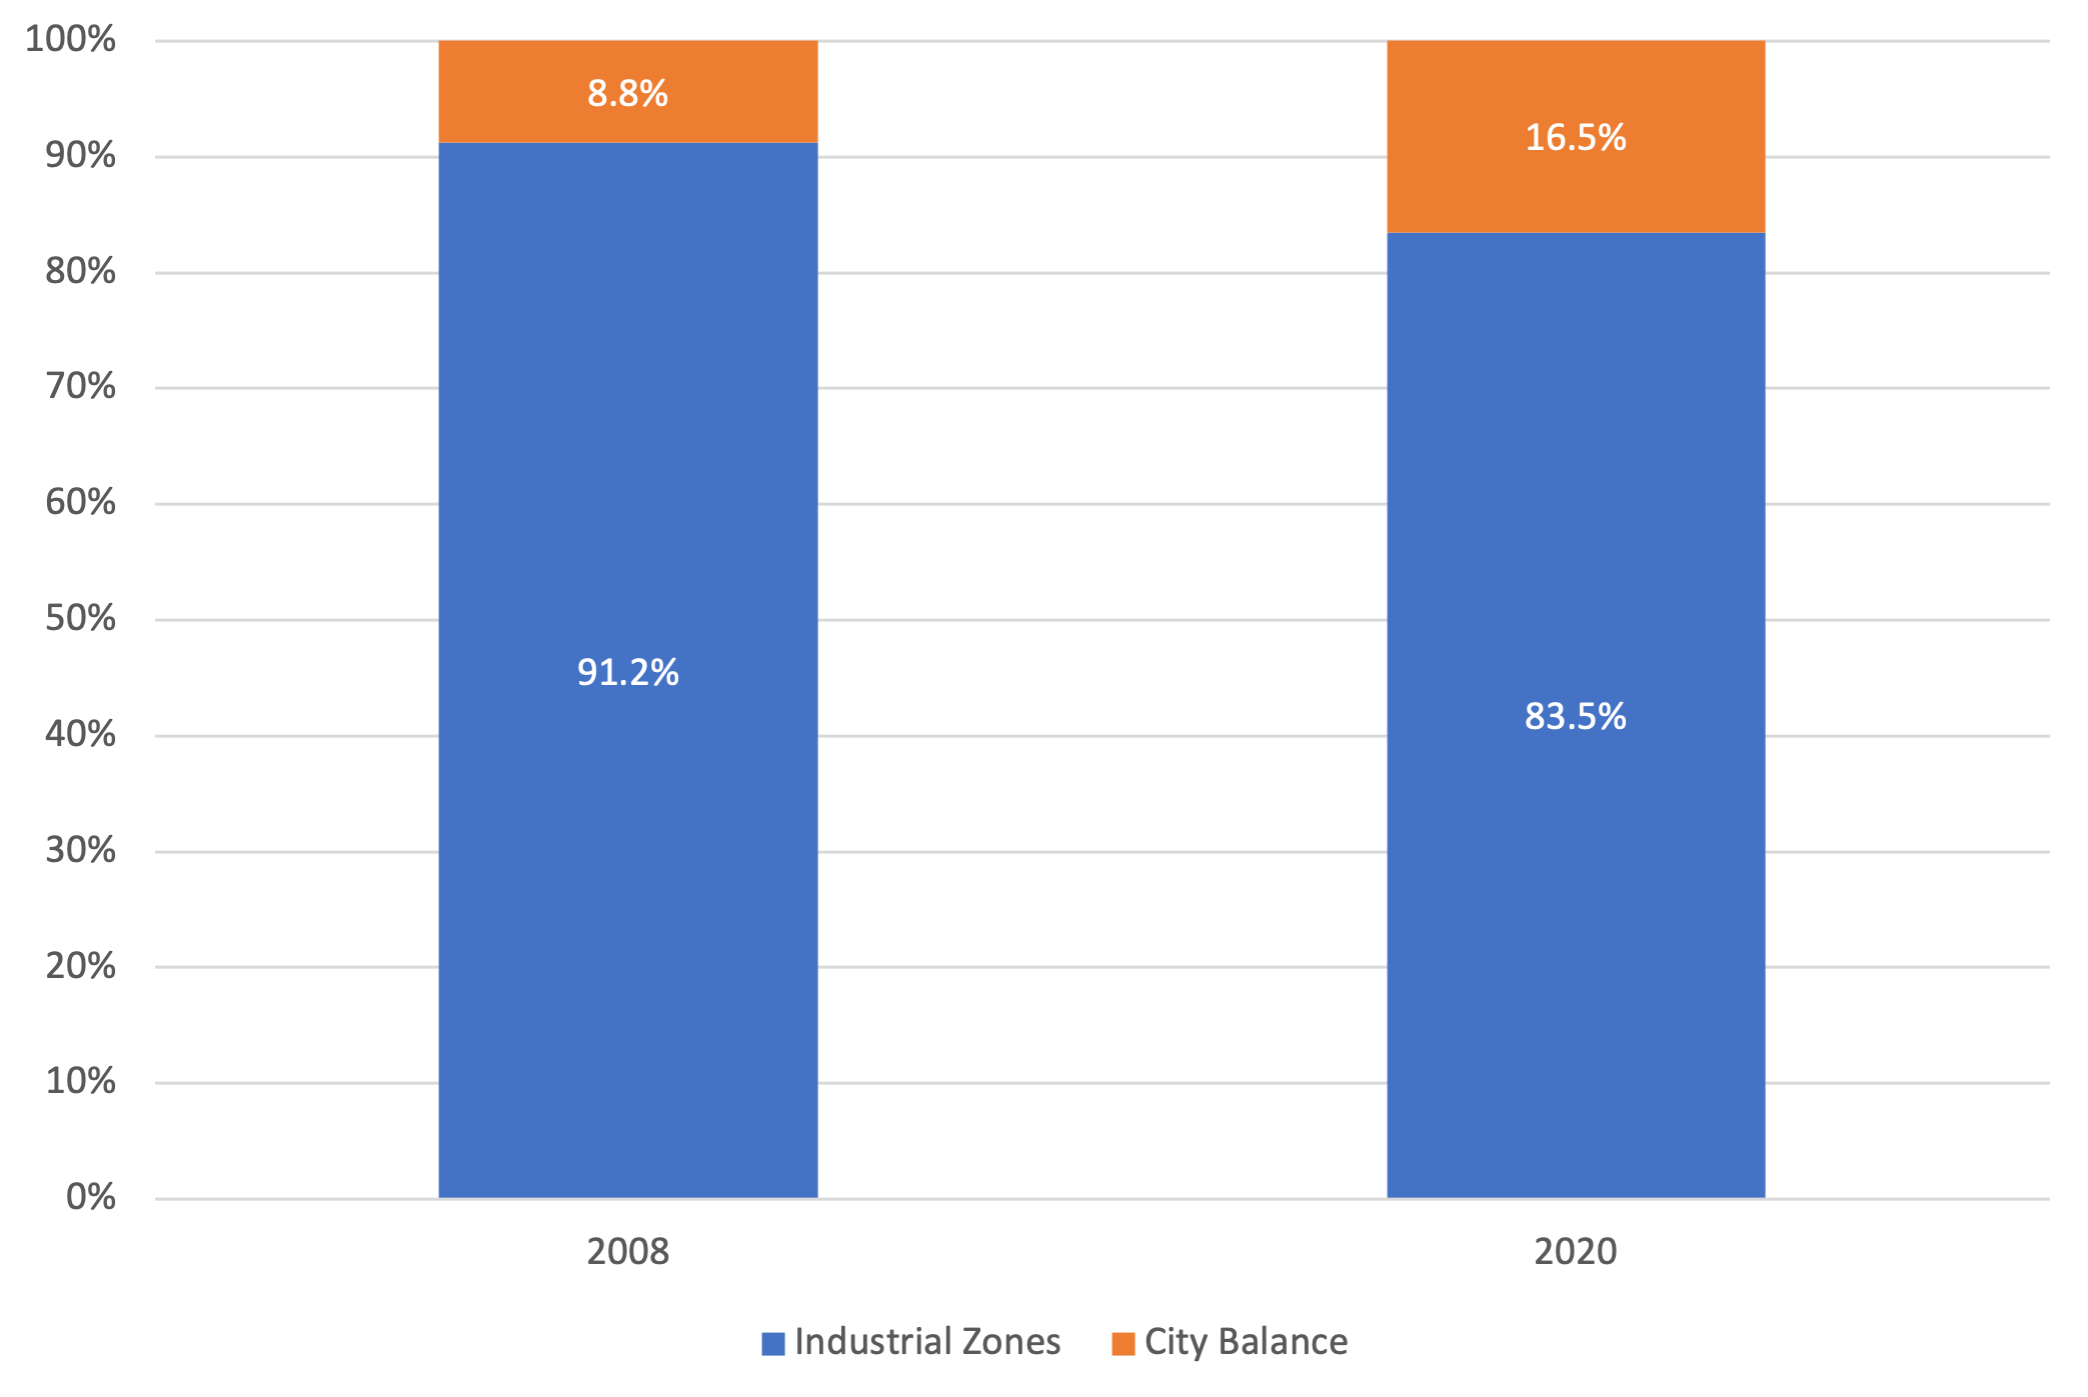
Source: ICIC analysis of Census Bureau Longitudinal Employment and Household Statistics, 2008-2020.
Comparing the number of jobs in each non-industrial sector in Saint Paul in 2008 to the corresponding number in 2022, we found that:
- From 2008 to 2022, the three non-industrial sectors that saw the greatest increase in number of jobs were health care and social assistance (7,603 jobs), public administration (2,262 jobs), and educational services (1,134 jobs) (Figure 9).
- The three non-industrial sectors that experienced the greatest percent increase between 2008 and 2022 were health care and social assistance (20.4%), professional, scientific, and technical services (11.7%), and public administration (10.1%).
- The three sectors that lost the greatest number of jobs between 2008 and 2022 were finance and insurance (-3,150 jobs), waste management services (-2,897 jobs), and retail trade (-2,406 jobs).
- Waste management services (-26.6%), retail trade (-24.7%), and management of companies and enterprises (-25.4%) were the three non-industrial sectors that lost the greatest percentage of employment during that period.
- No data are available for the information sector between 2008 and 2012, but it lost 1,867 jobs (around 34.6 percent) between 2013 and 2022.
- Data are also unavailable for the construction sector between 2008 and 2013, as well as for 2020 and 2021. It lost 428 jobs between 2014 and 2022, a decline of about 8 percent.
Figure 9. Non-Industrial Employment in Saint Paul, by Sector, 2008 and 2022
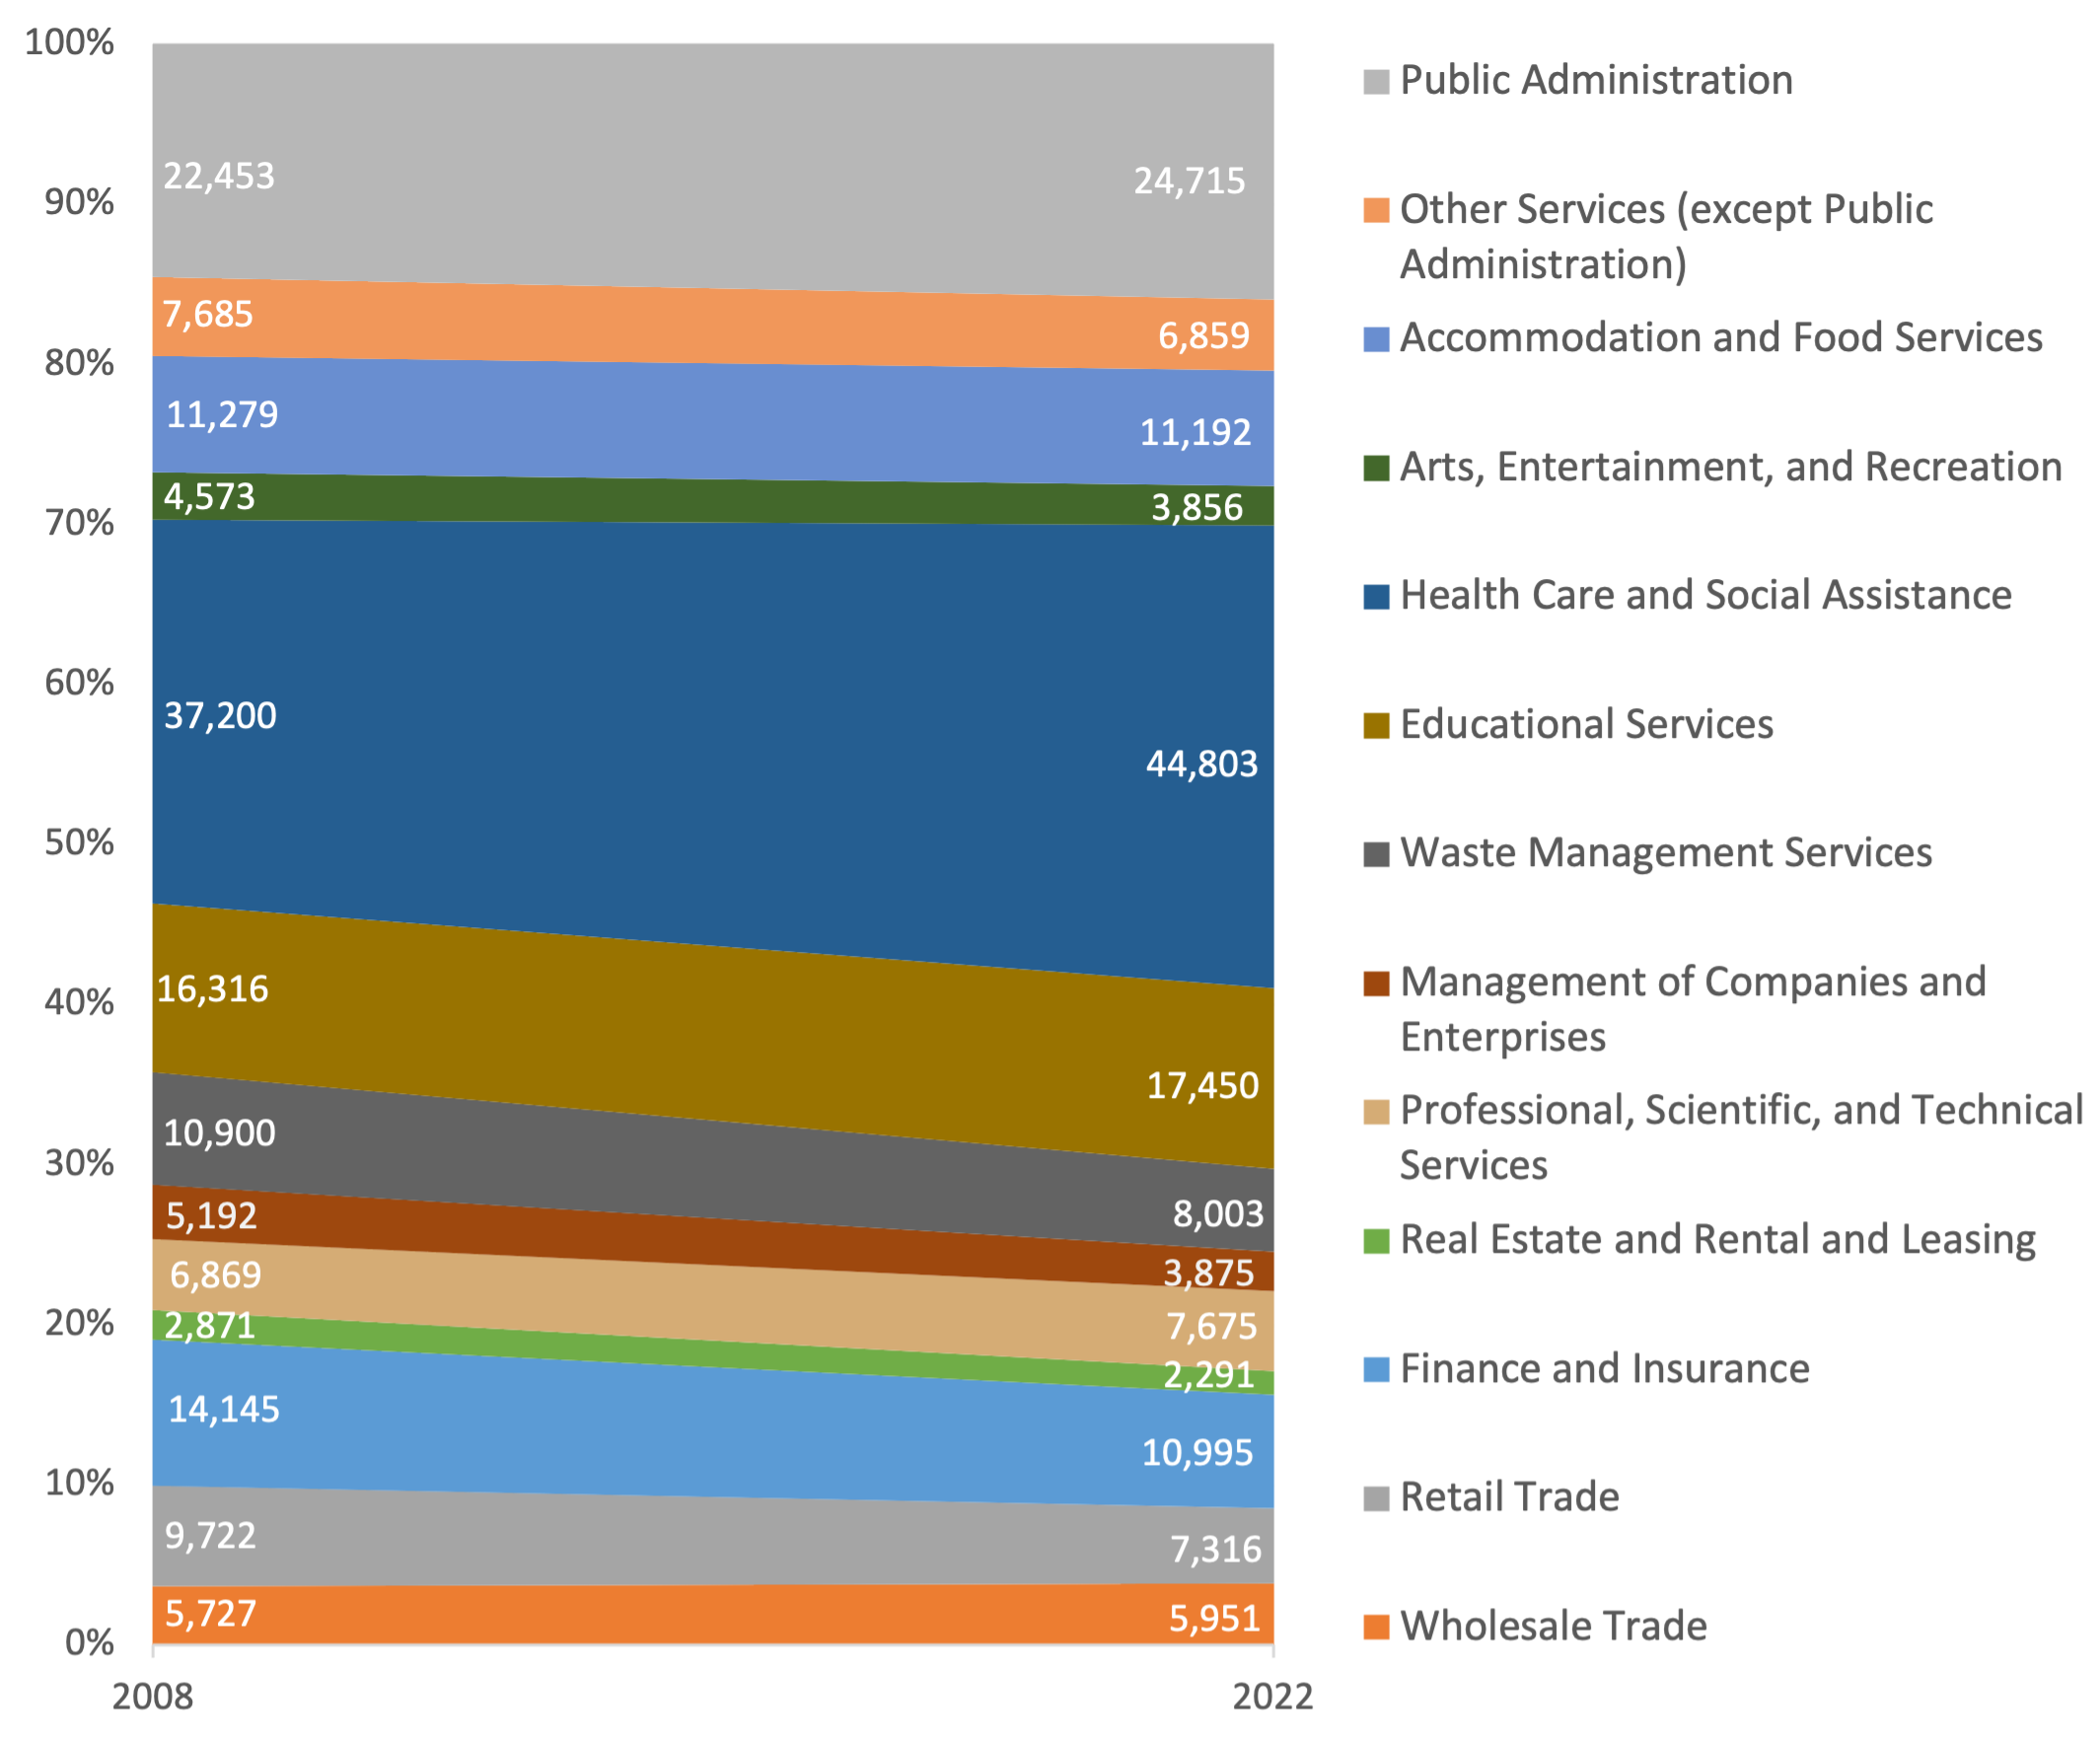
Note: Data are unavailable for the construction and information sectors.
Source: ICIC analysis of Bureau of Labor Statistics Quarterly Census of Employment and Wages, 2008-2022.
GEOGRAPHY OF INDUSTRIAL AND NON-INDUSTRIAL EMPLOYMENT
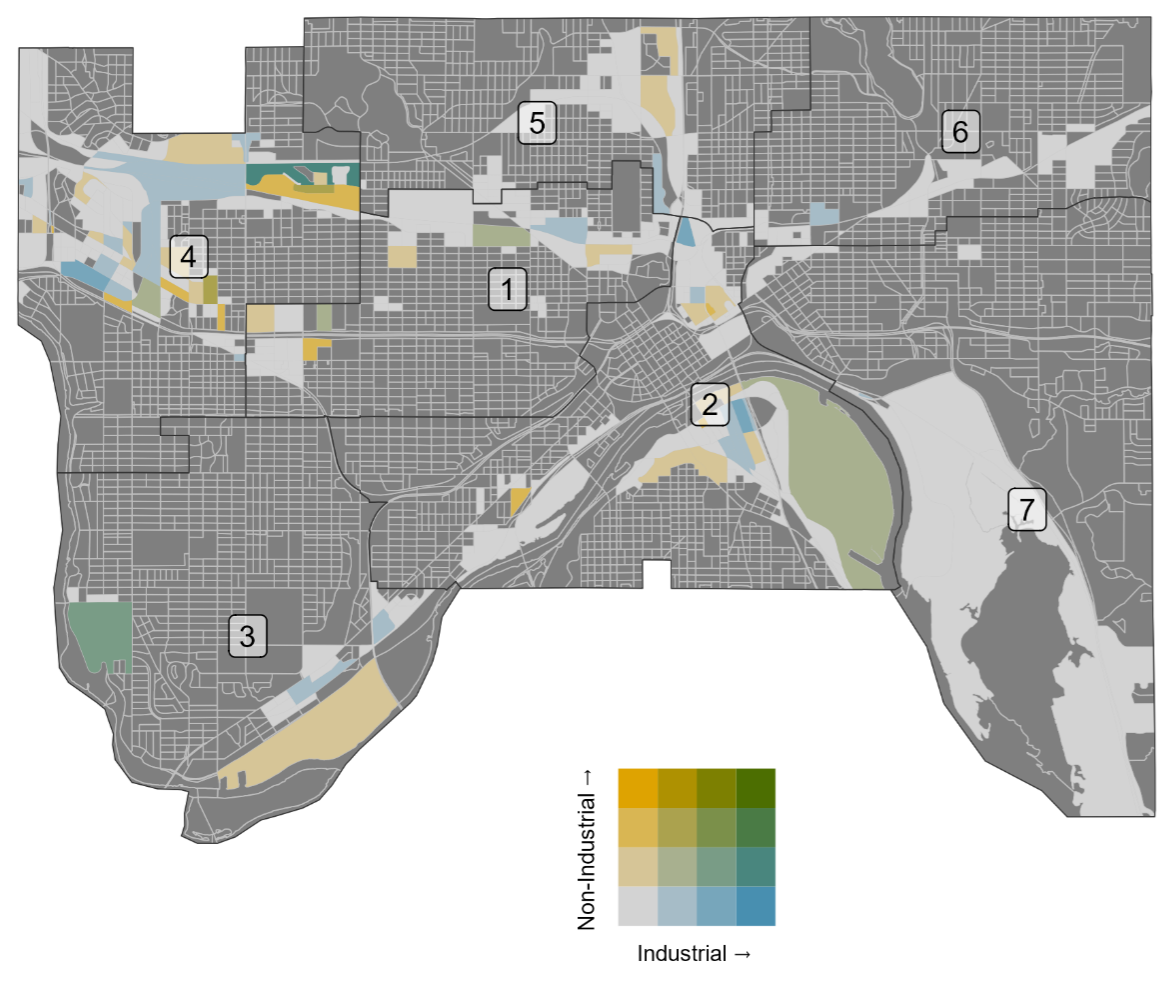
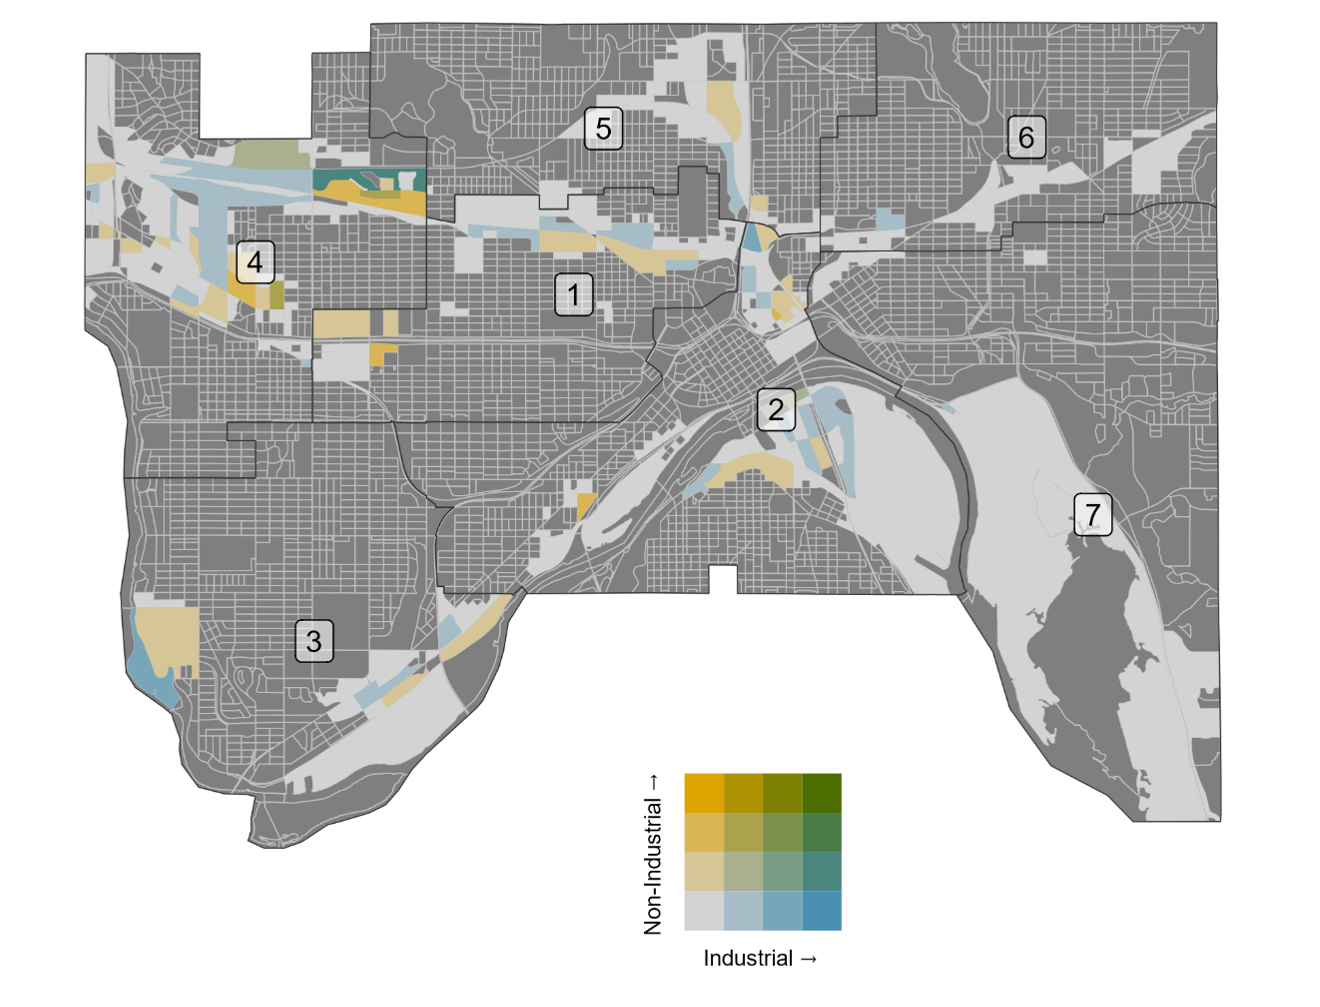
Our analysis of employment in industrial and non-industrial sectors suggests that industrial jobs are decentralizing from the city’s industrial zones. To understand these dynamics in greater geographic detail, we also examined trends in the spatial concentration of industrial and non-industrial employment across all census blocks inside the industrial zones.
The color scale of figure 10 groups employment values into four most-similar classes for industrial and non-industrial businesses and fills each census block inside Saint Paul’s industrial zones by combining the color values for the block’s industrial and non-industrial employment.
Blocks that are “yellower” contain greater numbers of non-industrial jobs, while “bluer” blocks contain more industrial jobs. Darker blocks contain greater employment overall, while lighter blocks contain less. This scale enables us to track the density of employment in the city’s industrial zones over time and examine where industrial and non-industrial jobs were most concentrated.
Between 2008 and 2012, industrial land use in the city’s industrial zones was found primarily in Ward 4, in the areas surrounding Energy Park in the northwest, in Ward 2 around the Downtown airport, and in Ward 3, particularly in the southwest neighborhood of Highland Park, where the Ford Twin Cities Assembly plant was located.
Figure 10. 2008 Employment in Saint Paul’s Industrial Zones
Source: ICIC analysis of Census Bureau Longitudinal Employment and Household Statistics, 2008-2020.
Non-industrial land use in the industrial zones of Saint Paul was concentrated mostly in the northwest, in Ward 4 (Figure 11).
Figure 11. 2012 Employment in Saint Paul’s Industrial Zones
Source: ICIC analysis of Census Bureau Longitudinal Employment and Household Statistics, 2008-2020.
- Between 2012 and 2014, industrial land use diminished in the industrial zones south of downtown Saint Paul, in Wards 2, 3 and 7, and most notably in Ward 3 following the 2012 closure of the Ford plant.
- By 2014, industrial land use was concentrated primarily in Ward 4 around Energy Park and on the southern bank of the Mississippi in Ward 2.
- Figure 12 shows that by 2014, the zone previously occupied by the Ford plant had been completely converted from industrial to non-industrial use.
Figure 12. 2014 Employment in Saint Paul’s Industrial Zones
Source: ICIC analysis of Census Bureau Longitudinal Employment and Household Statistics, 2008-2020.
- Overall employment in the industrial zones, particularly in industrial businesses, recovered somewhat across between 2016 and 2020.
- During this period, the highest concentrations of industrial land use fell between the Downtown Airport and Pig’s Eye Lake, and in the area surrounding Energy Park in Ward 4.
Figure 13. 2020 Employment in Saint Paul’s Industrial Zones
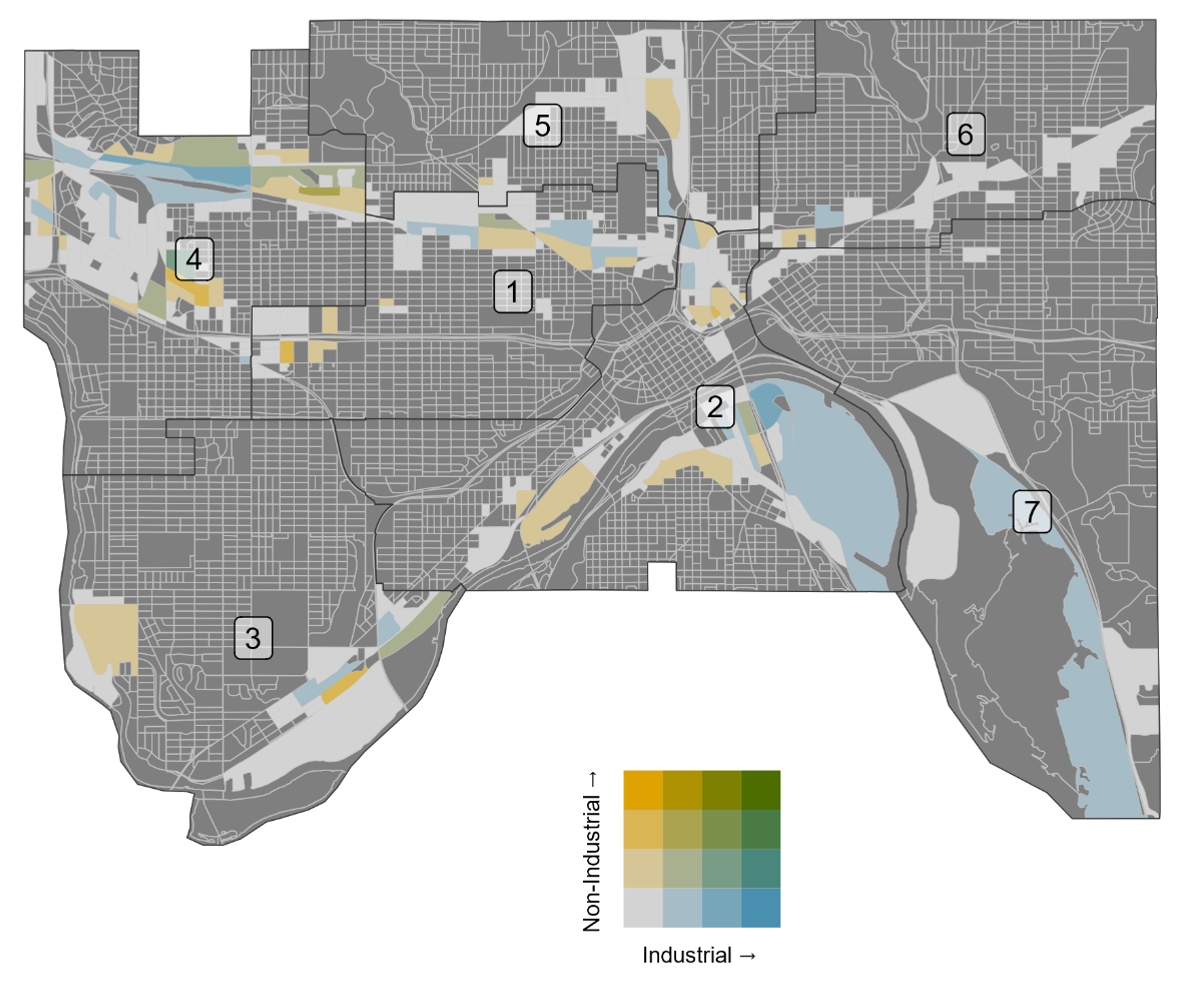
Source: ICIC analysis of Census Bureau Longitudinal Employment and Household Statistics, 2008-2020.
These results suggest that efforts to protect and revitalize industrial land in Saint Paul will be essential to sustaining its industrial economy, and ensuring the city has enough designated space to maintain those industries that are crucial for supporting its fiscal health.
ECONOMIC IMPACT ANALYSIS
In addition to estimating the fiscal impact of industrial land use in Saint Paul, which involved reviewing the spending and collection of public funds across the city, we also investigated the economic impacts of the Port Authority business centers, a set of 22 currently operational brownfield redevelopment projects across the city, and the projected impact of The Heights, a mixed-use residential and light industrial development slated to be finished by 2030. The PORT AUTHORITY business centers support a mixture of industrial and non-industrial land uses, and are occupied by some of the largest private enterprises in the state.
We used IMPLAN economic impact analysis software to model the economic output and employment effects of the Port Authority business centers and The Heights development on the Zip codes that include Saint Paul. These analyses yielded the following key results:
- The combined output of all firms located in the Port Authority business centers, which include some of the largest companies in the state, was $9.3 billion in 2022.
- Firms located in the business centers supported a combined 43,491 jobs in 2022.
- The construction of the Heights will support an average of 940 jobs and $146.3 million in economic output between 2024 and 2028.
- Between 2025 to 2030, the residential and light industrial activities at the Heights will have a combined economic output of $265.6 million, and an employment impact of 1,088 jobs.
IMPLAN uses an input-output model and local data on wages, industry composition, and other characteristics of the economy to estimate the total number of jobs and the total dollar amount of economic activity that will result from the construction and operation of The Heights. These totals are the combination of:
1) The employment or economic output directly supported by these businesses.
2) The employment or economic output indirectly supported though supplier purchasing.
3) The induced employment or economic output created by local spending of employees of businesses in the business centers.
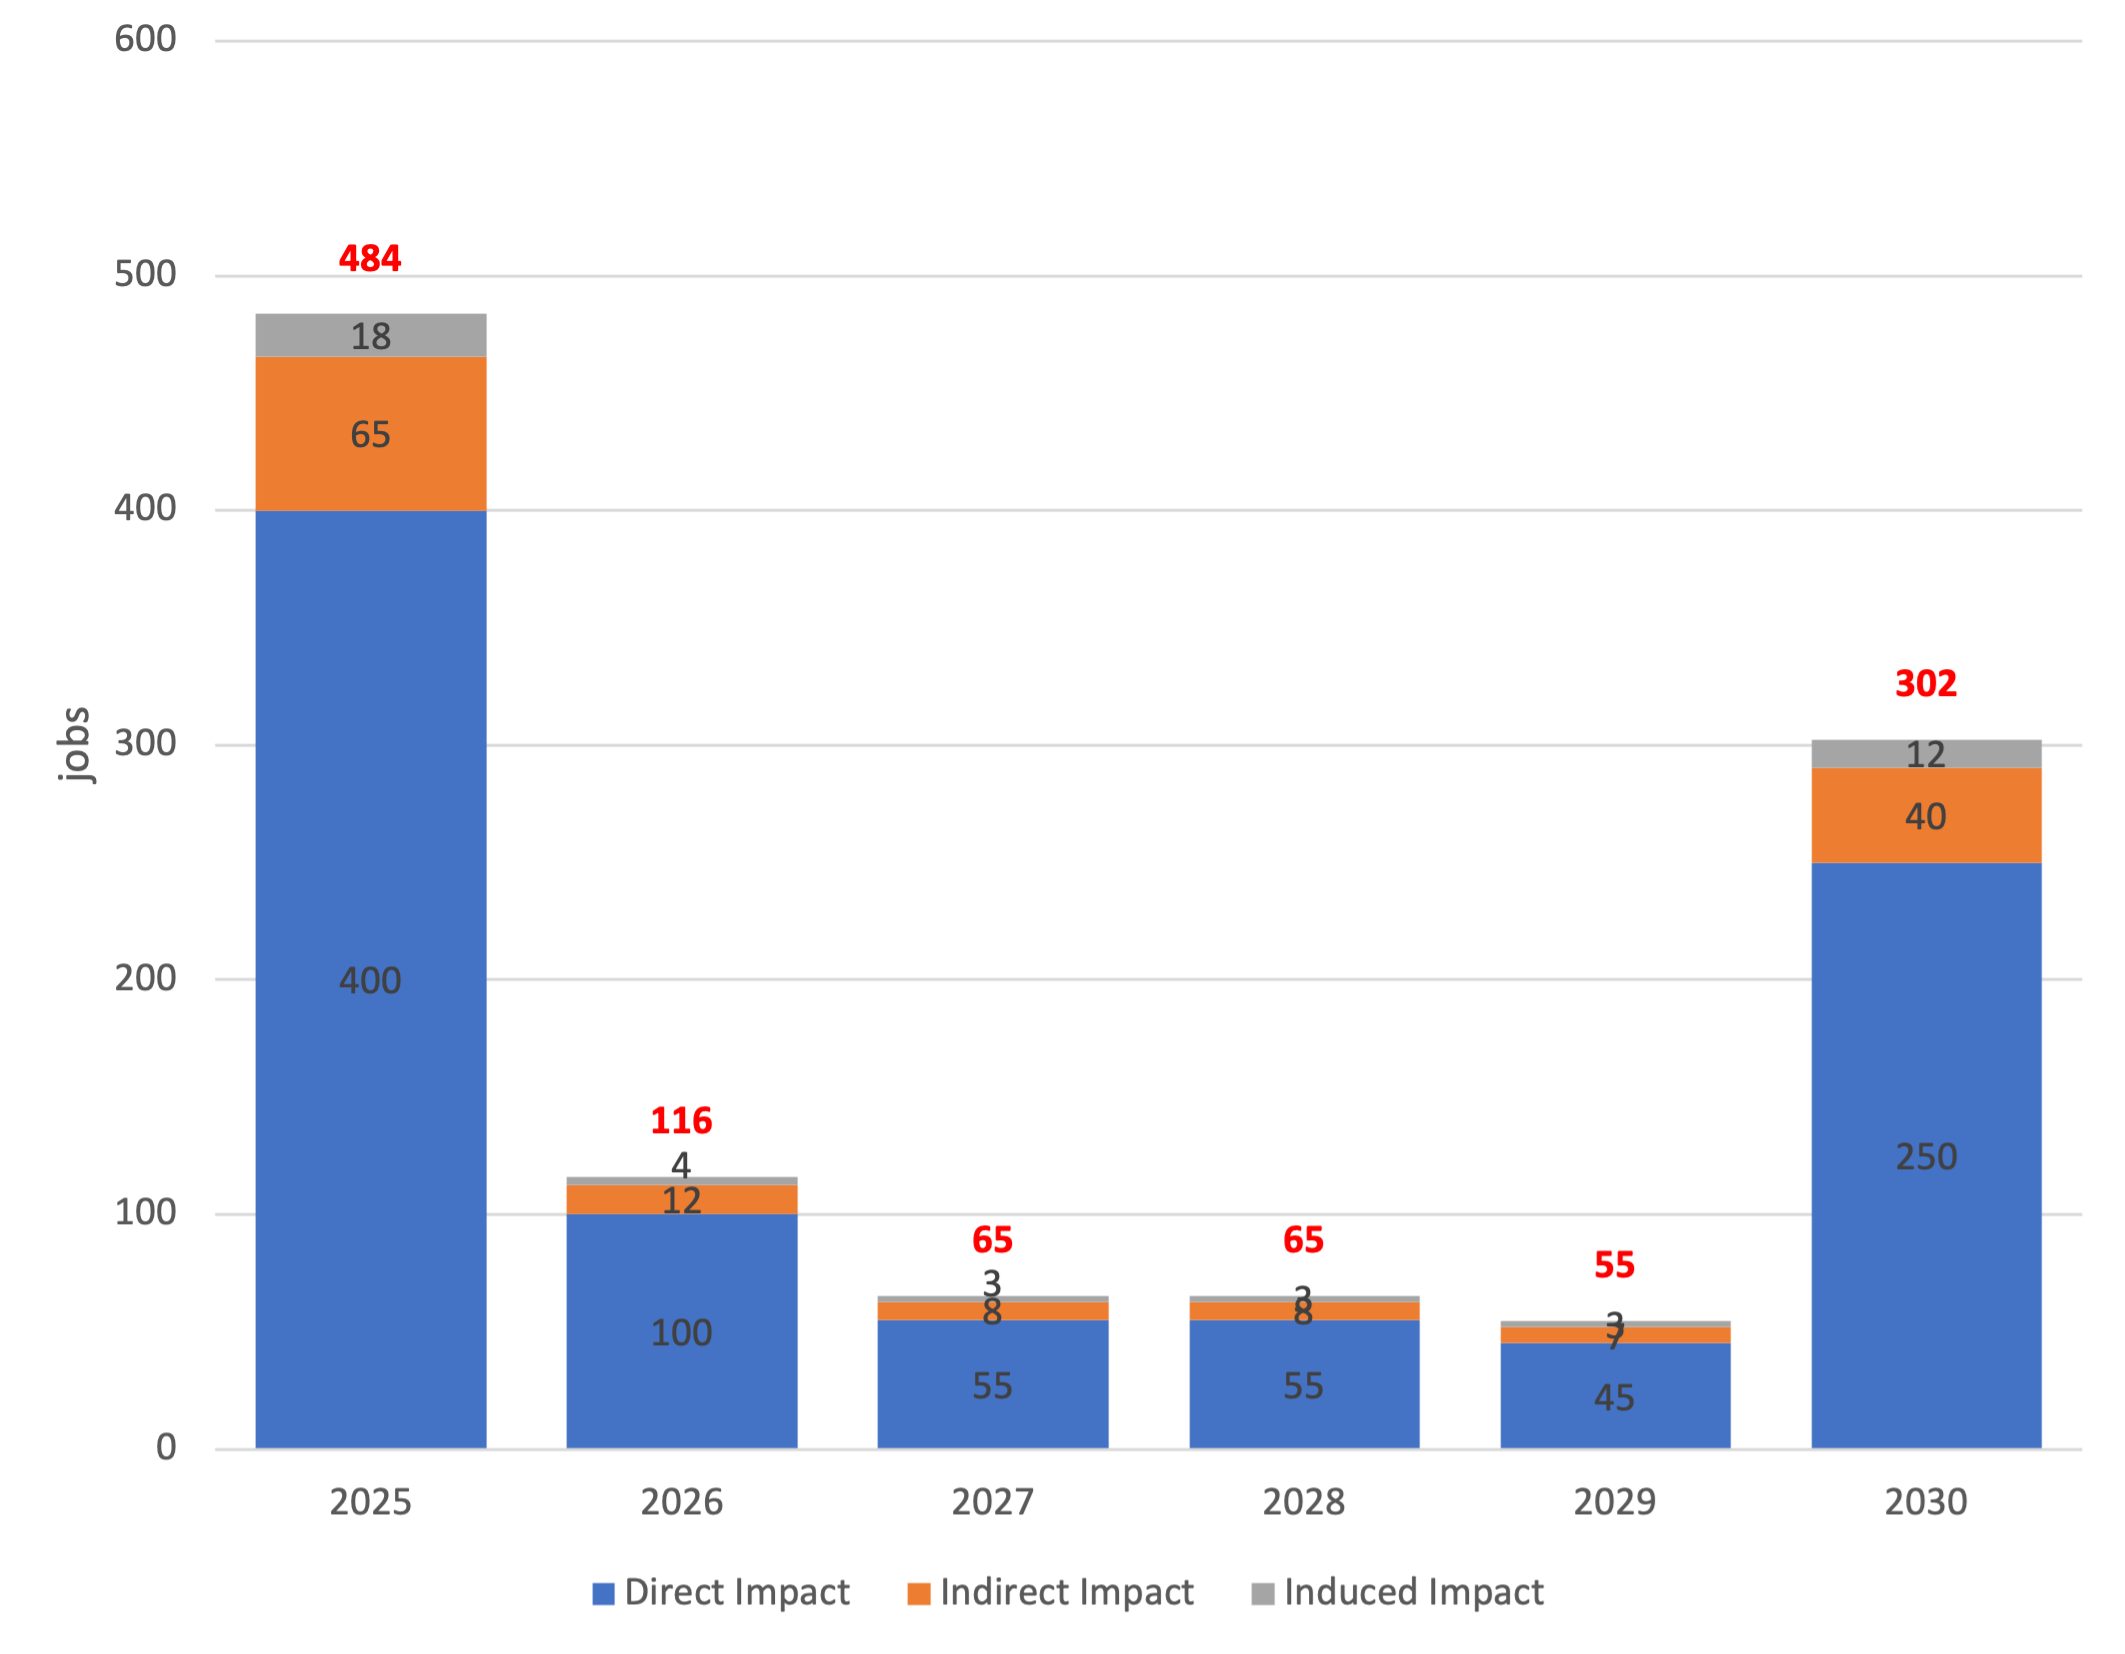
Figure 14. Projected Employment Impact of The Heights Development, 2025-2030
Source: ICIC analysis of IMPLAN data and Saint Paul Port Authority projections of The Heights employment and revenue.
- We estimate that The Heights will have a cumulative employment impact of 1,088 jobs by 2030, when it is expected that all the residential properties will be complete, and all the light industrial properties are rented and operational.
- Additionally, construction of the development will support an average of 940 jobs each year from 2025 to 2028.
Figure 15. Projected Economic Impact of The Heights Development, 2025-2030
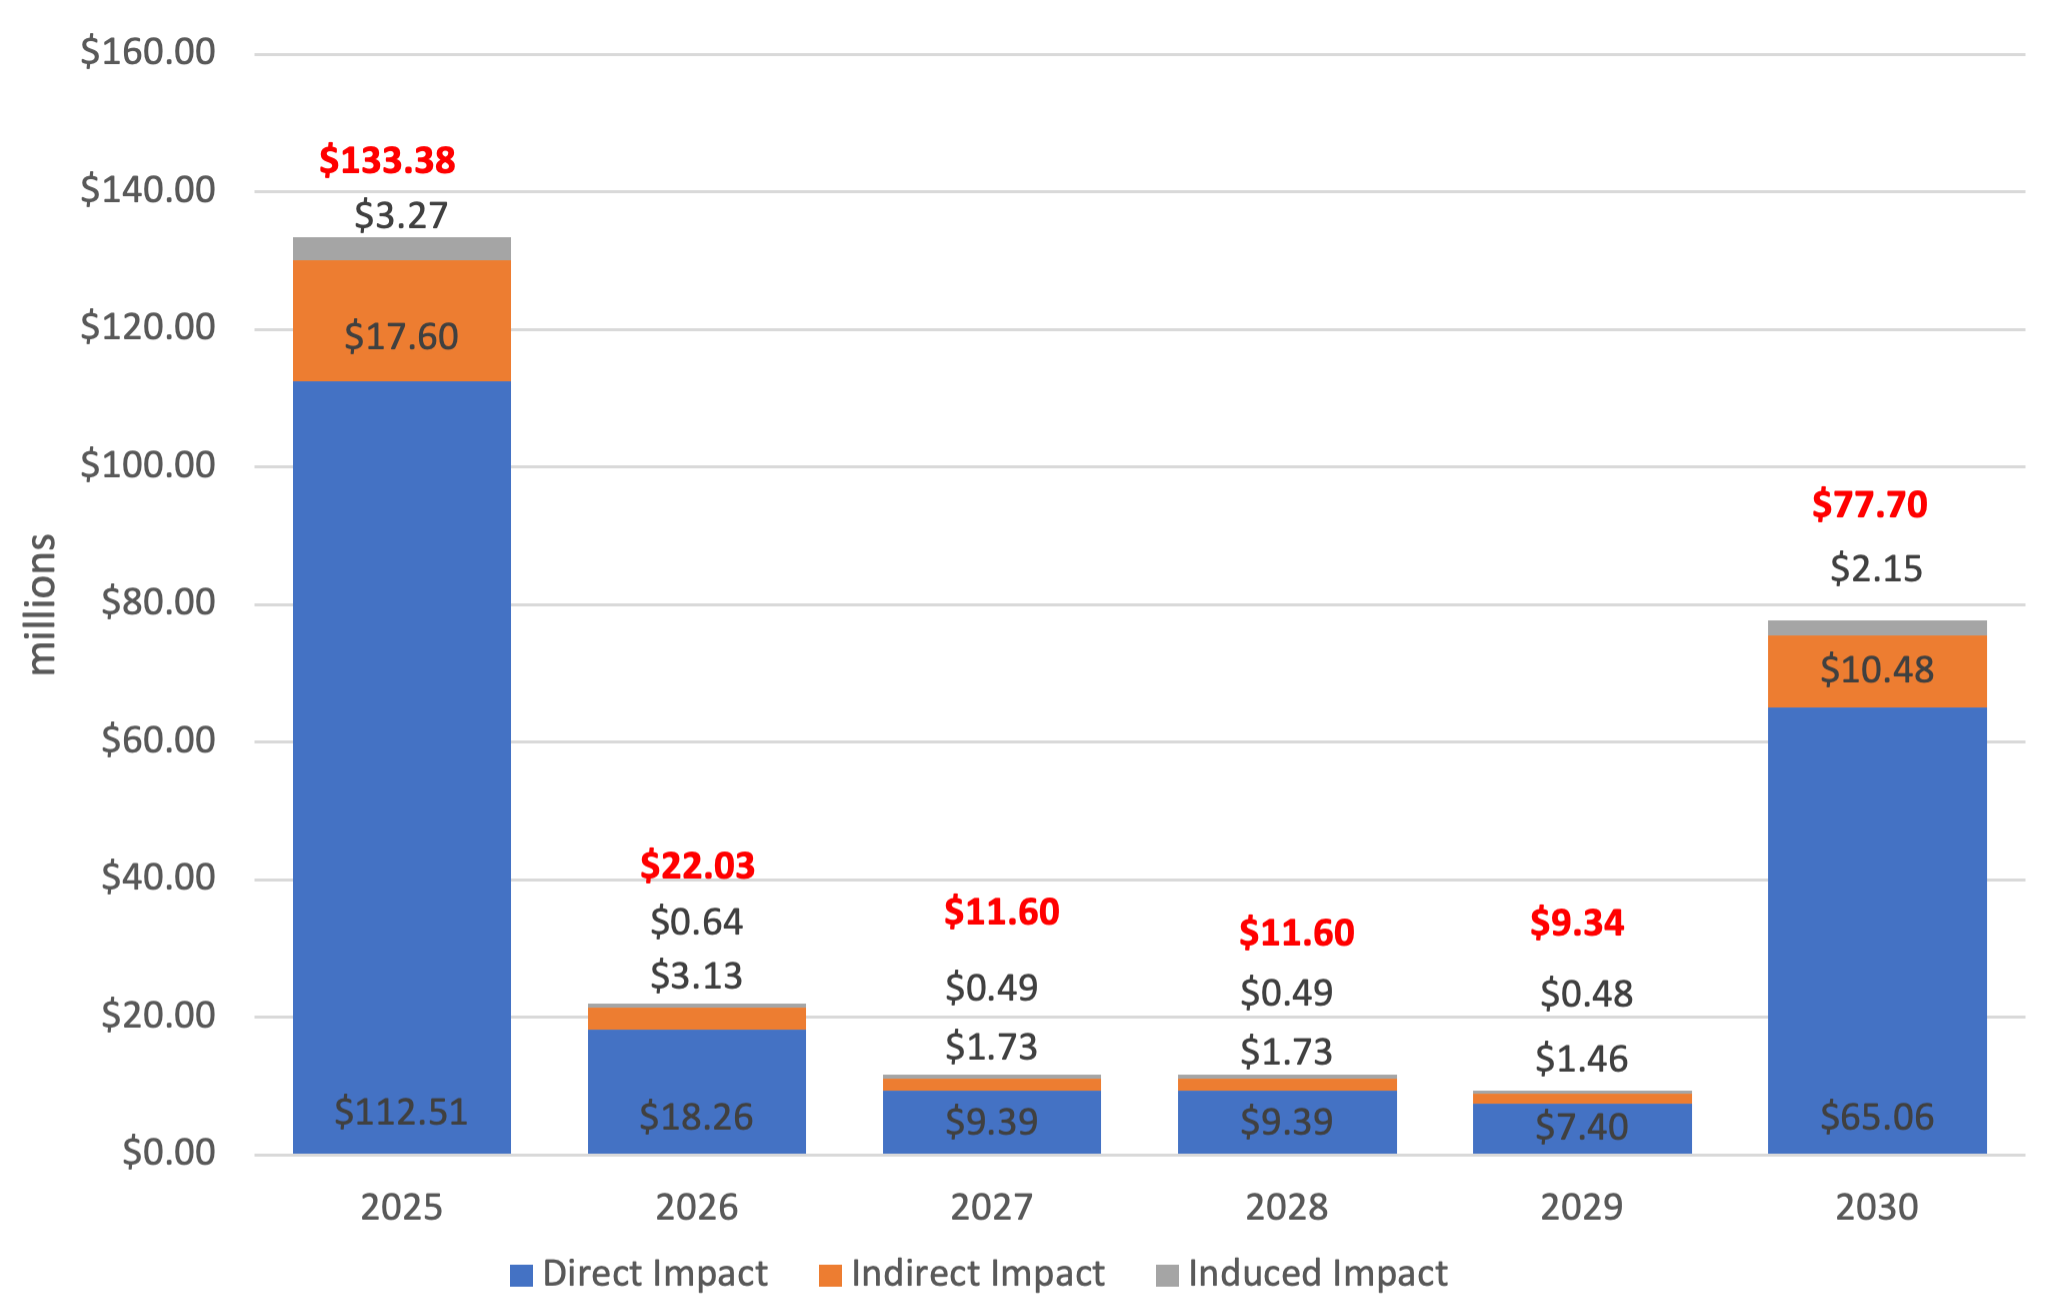
Source: ICIC analysis of IMPLAN data and Saint Paul Port Authority projections of The Heights employment and revenue.
- We estimate that The Heights development will have a cumulative economic impact of $265.6 million by 2030.
- Additionally, we estimate that the average annual economic output of construction of the Heights will be $146.3 million between 2025 and 2028.
Economic Impact of Port Authority Business Centers in 2022 Dollars
Figure 16. Economic Output and Employment Impacts of Businesses in Saint Paul Port Authority Business Centers in 2022
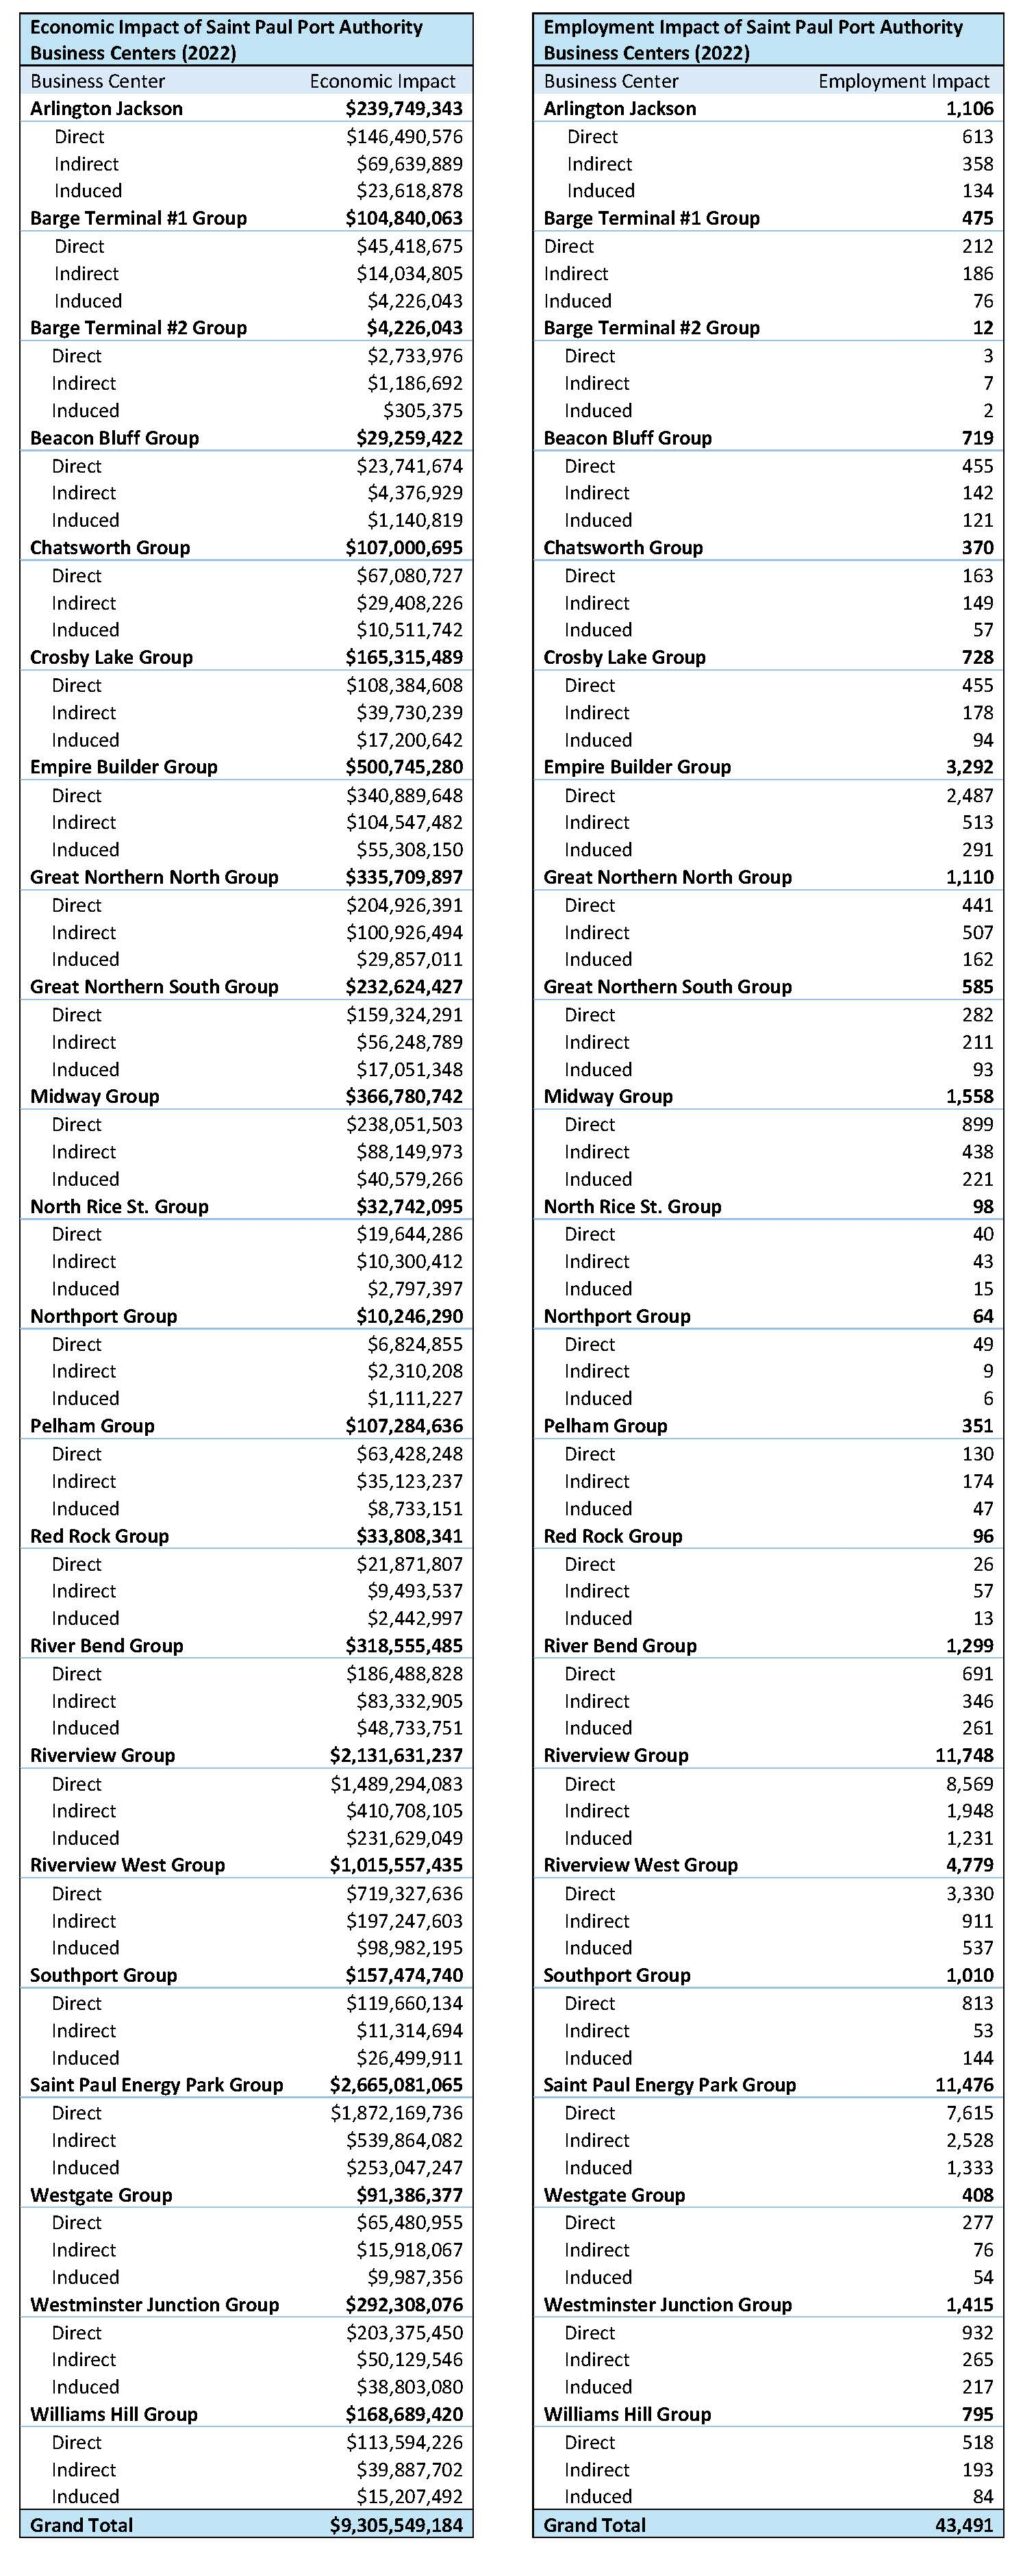
Source: ICIC analysis of IMPLAN data and Saint Paul Port Authority estimates of Heights employment and revenue.
We used IMPLAN to estimate the economic contributions of businesses operating in Port Authority business centers in 2022.
- We estimate that firms located in the business centers directly supported about 28,999 jobs and an output of $5.83 billion.
- These firms indirectly support an additional 9,295 jobs and $1.8 billion dollars through purchasing from suppliers.
- Firms located in Port Authority business centers indirectly support an additional $873 million in local spending and an additional 5,197 jobs.
CONCLUSION
Public perception of industrial land can be dominated by concerns about property value, pollution, noise, and environmental harm. In many instances, these concerns are valid; some industrial activities present very real risks to resident health and the environment, especially among socially and economically vulnerable populations.
However, this is not the only side to the story. There are also a number of ways in which industrial land use is integral to the economic and social fabric of the city and can contribute to the goals of improving standard of living and economic well-being of residents and workers in cities such as Saint Paul.
First, industrial (particularly light industrial) land use plays an outsized role in funding public amenities and infrastructure in Saint Paul. Unlike residential, retail, and other commercial land use, industrial land contributes more in taxes, fees, and other public revenue streams than it requires of city resources. It also occupies relatively little land area in the city.
Light industrial uses are marginally uses in terms of net impact per acre, and have few or none of the downsides associated with living or working near manufacturing and other heavy industry (noise, light, and environmental pollution, etc.). Light industrial properties also often include businesses that are directly beneficial to residents and workers, such as auto body shops, breweries, and small-scale manufacturing of consumer goods. In these ways, industrial land use directly supports the funding of public amenities, and consumer goods and services in Saint Paul.
Maintaining industrial land should also be a priority for equitable workforce development efforts. Our analysis of wage and industry data shows that industrial jobs in Saint Paul paid consistently higher average weekly wages than jobs in all other sectors for the fourteen year we examined (2008-2022). Growth in other high-value sectors, such as health care and social assistance, and scientific and technical services in Saint Paul is certainly positive, but these industries may not offer the same combination of low barrier-to-entry employment opportunities and high wages that sectors like manufacturing, utilities, and transportation and warehousing historically have.
The slight decentralization of industrial jobs from industrial zones, and the diminishing concentration of employment in the historical industrial parks in Saint Paul over the past decade and a half suggest that efforts to protect and revitalize industrial land uses in the city are more important now than ever. Protecting industrial land use in Saint Paul’s industrial zones supports accessible, good paying jobs, recognizes the crucial role these properties play in the city’s public finance, and acknowledges the profound economic impact that industrial businesses have on the local economy.
Furthermore, the Port Authority’s development agenda goes beyond protection and anticipates a new sort of industrial landscape. Through its brownfield redevelopment projects, the Port Authority converts vacant land, most of which previously supported industrial uses into commercial hubs, maintaining as much industrial use as possible, while also ensuring that valuable land receives the investment it needs in order to not sit vacant. Future projects, such as The Heights, may redefine the landscape of industrial land use, combining innovative mixed-use commercial, industrial and residential spaces with enormous economic potential.